...
| Note |
|---|
Do not use spaces for variable names. If needed, use an underscore. For example, “Question 1” will not be acceptable for a field name. Instead use Question1 or Question_1. Additionally, variable names are case-sensitive. [FOR_EXAMPLE], [For_Example], and [for_example] would be considered 3 different variables. |
Question types and how to create them:
...
| Expand | ||||||||||
|---|---|---|---|---|---|---|---|---|---|---|
| ||||||||||
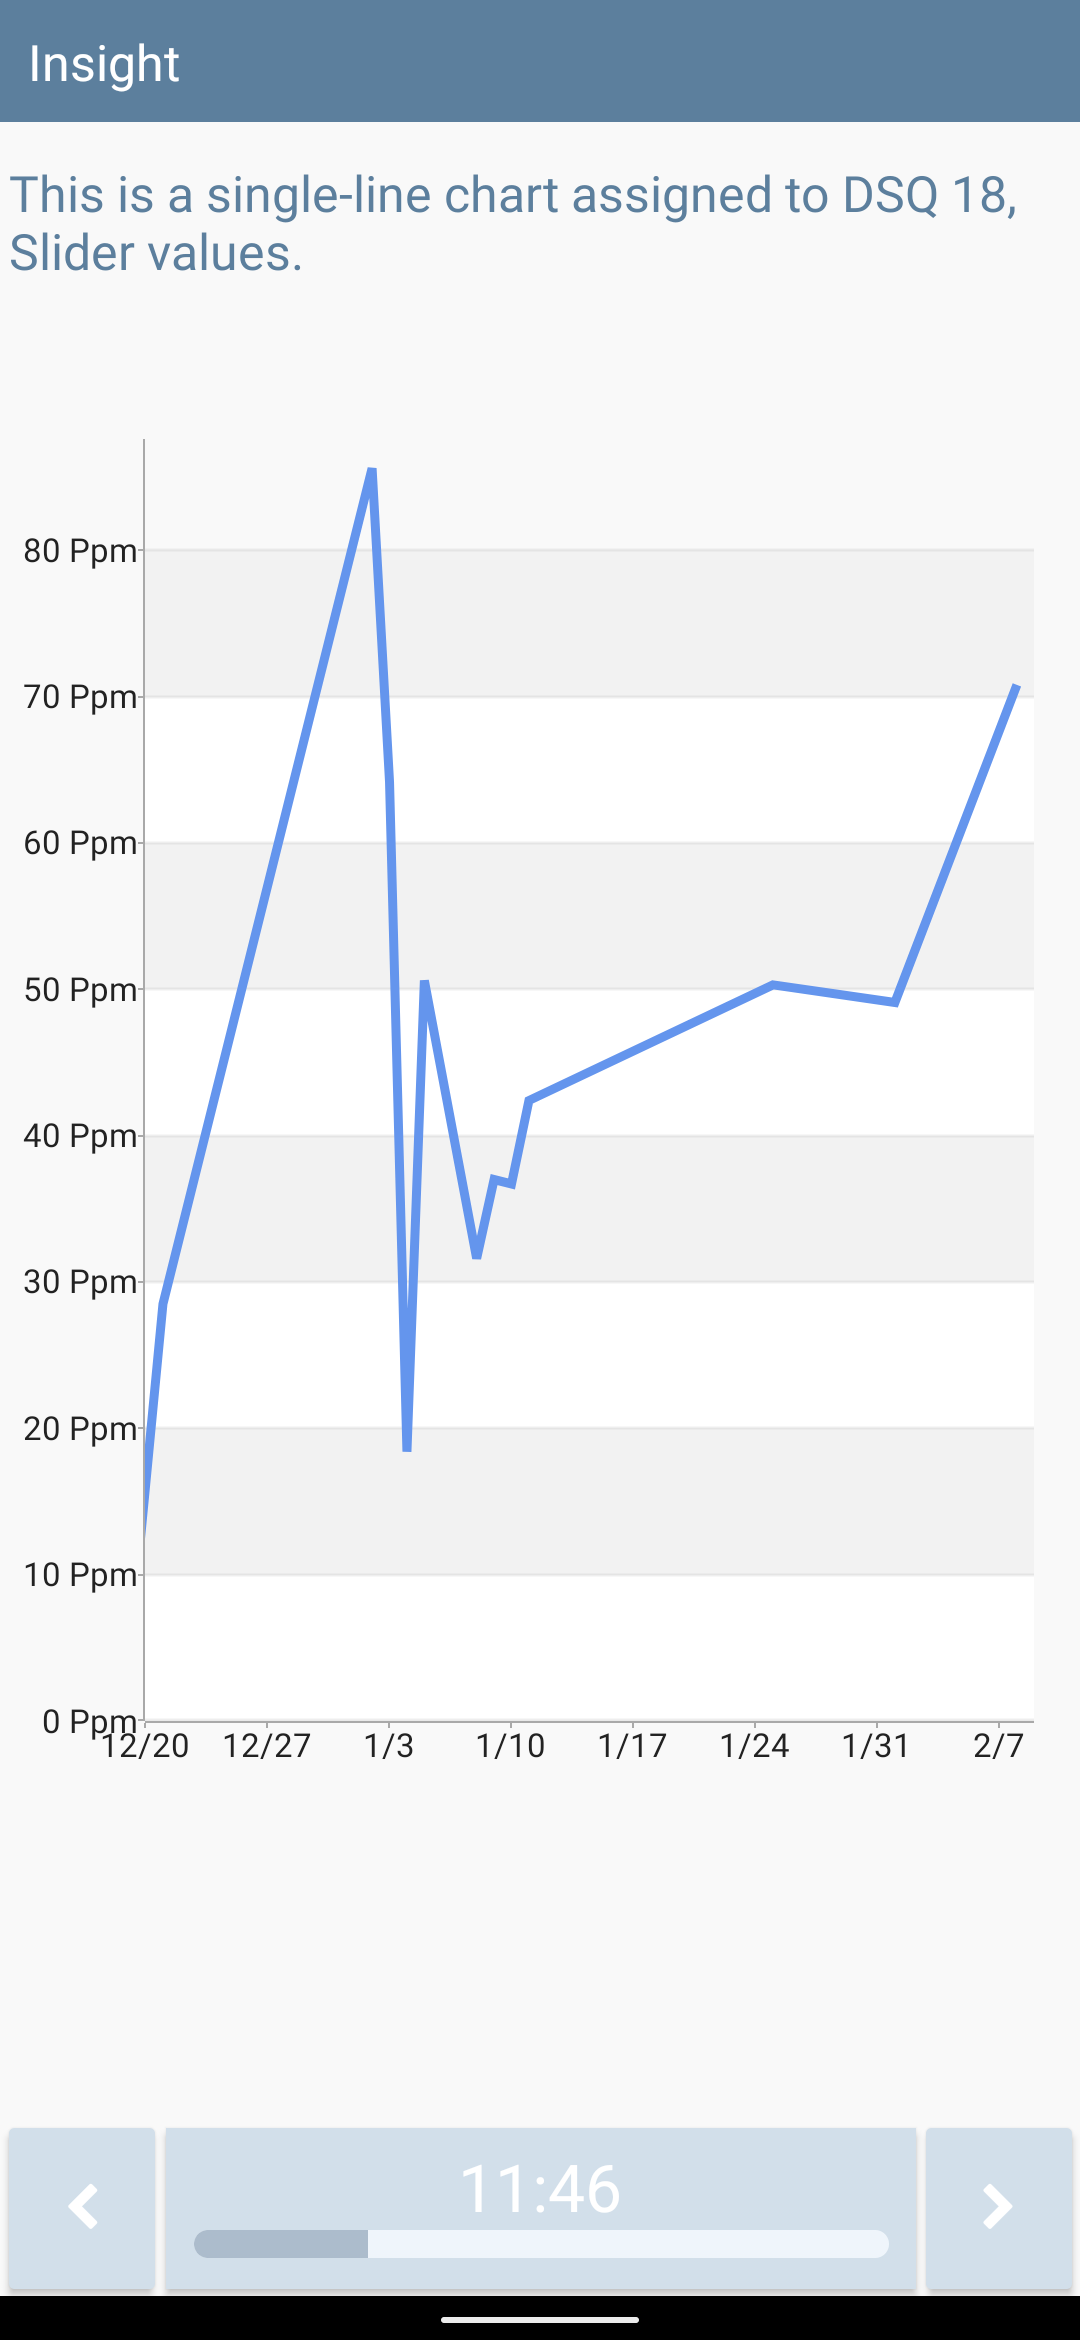
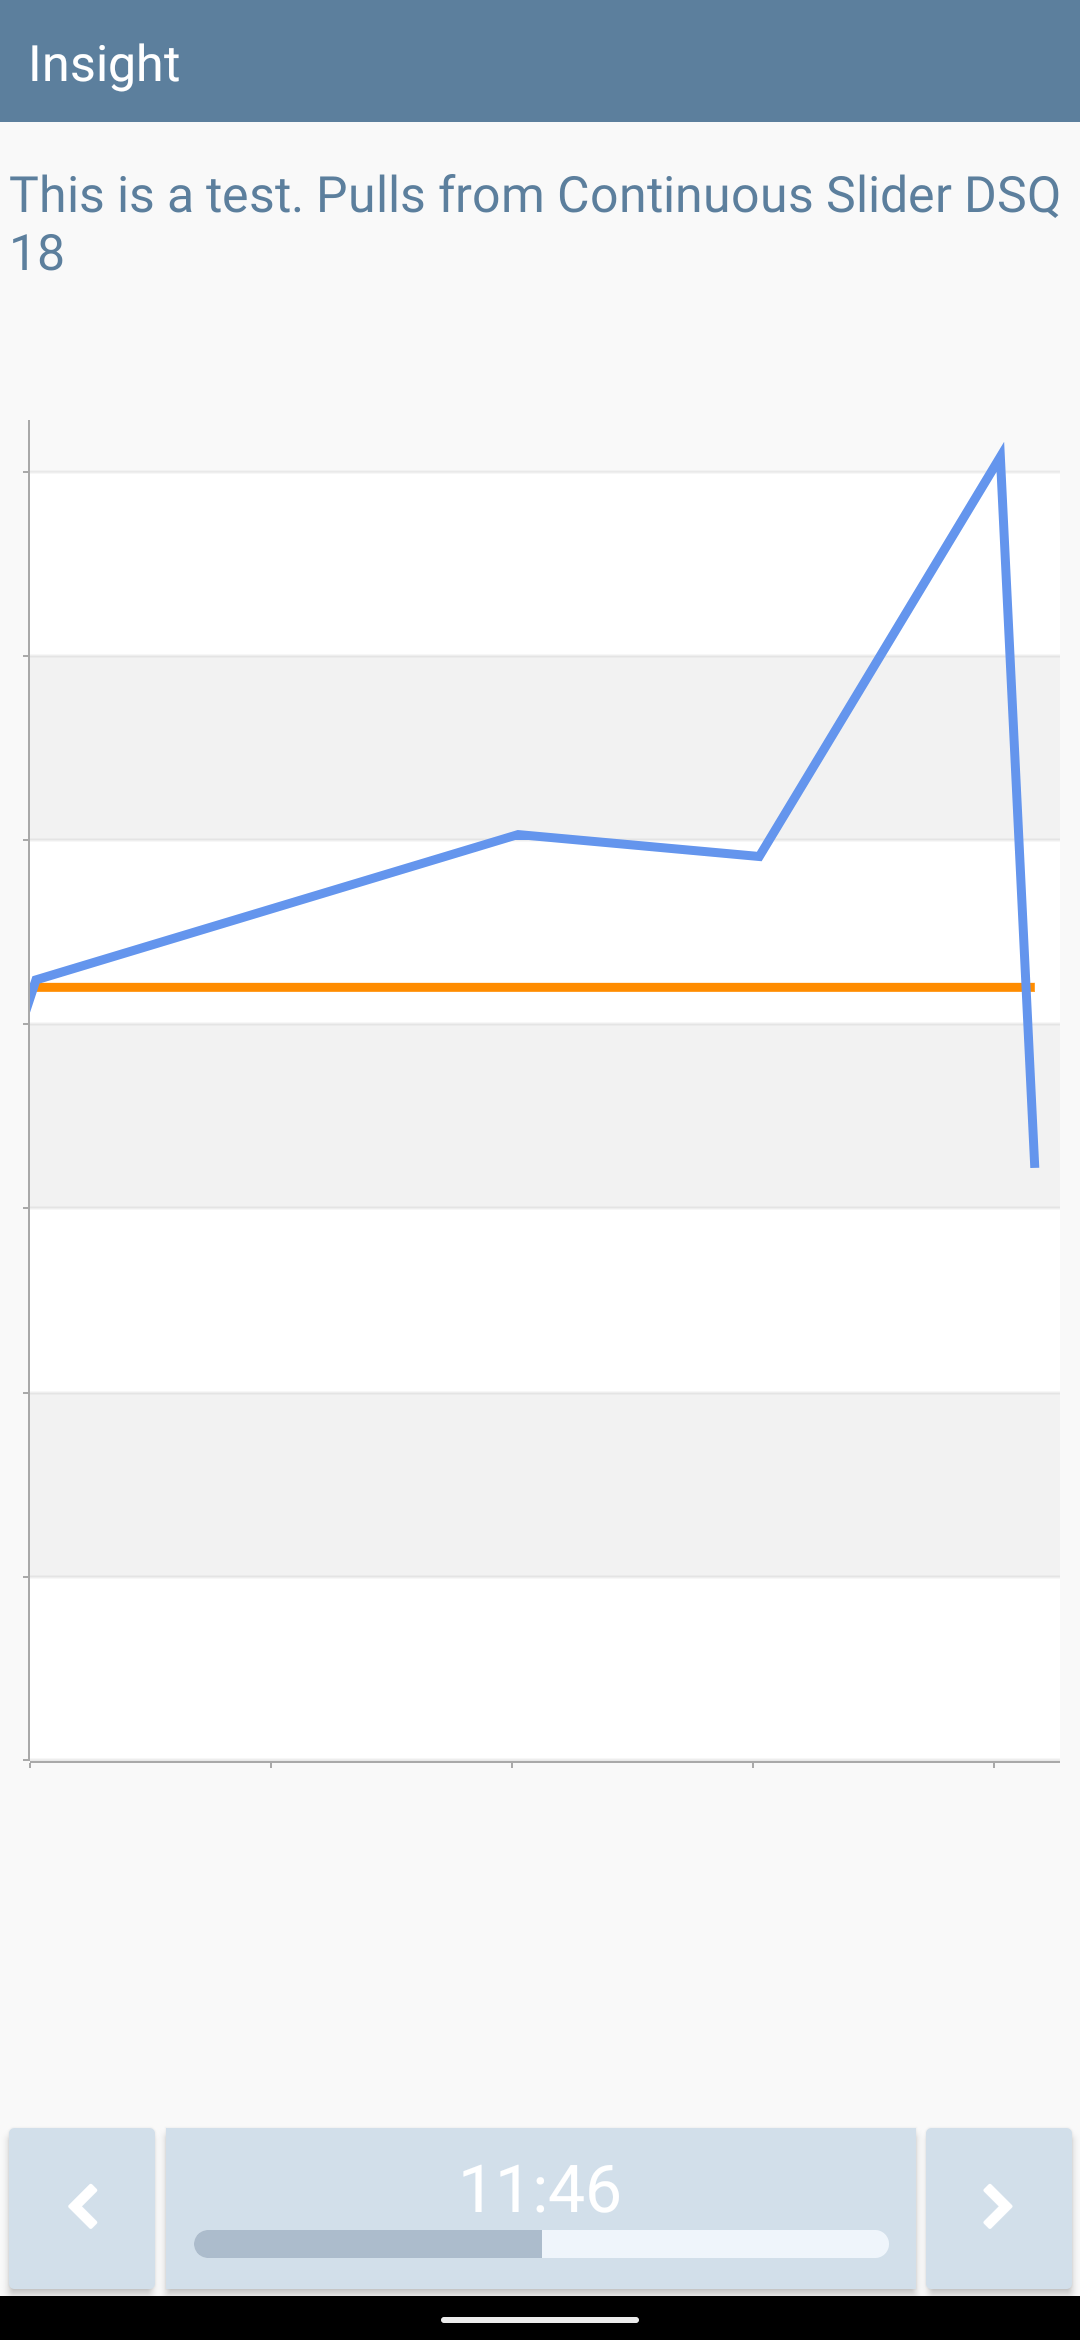
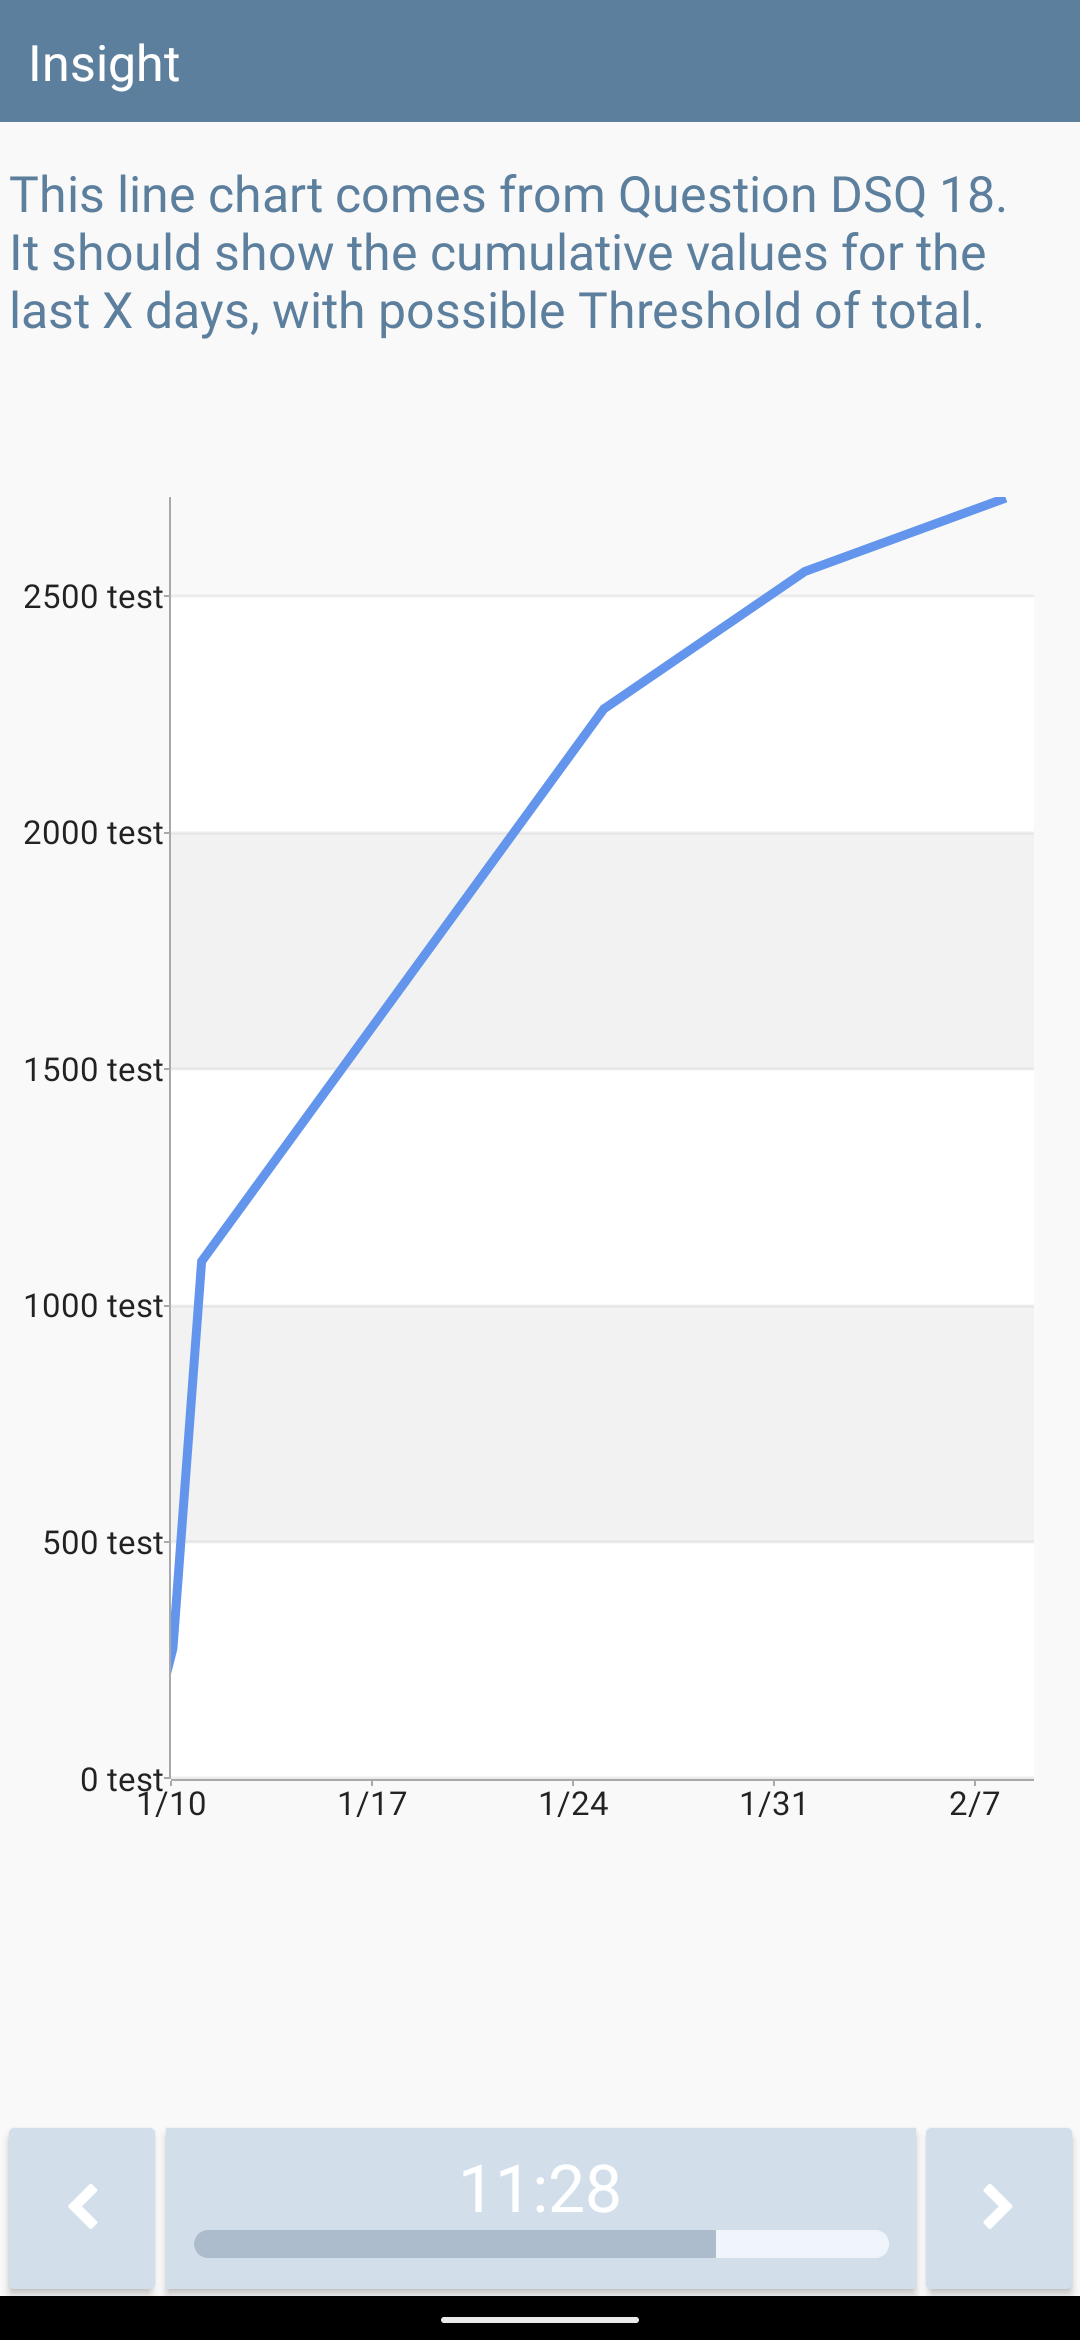
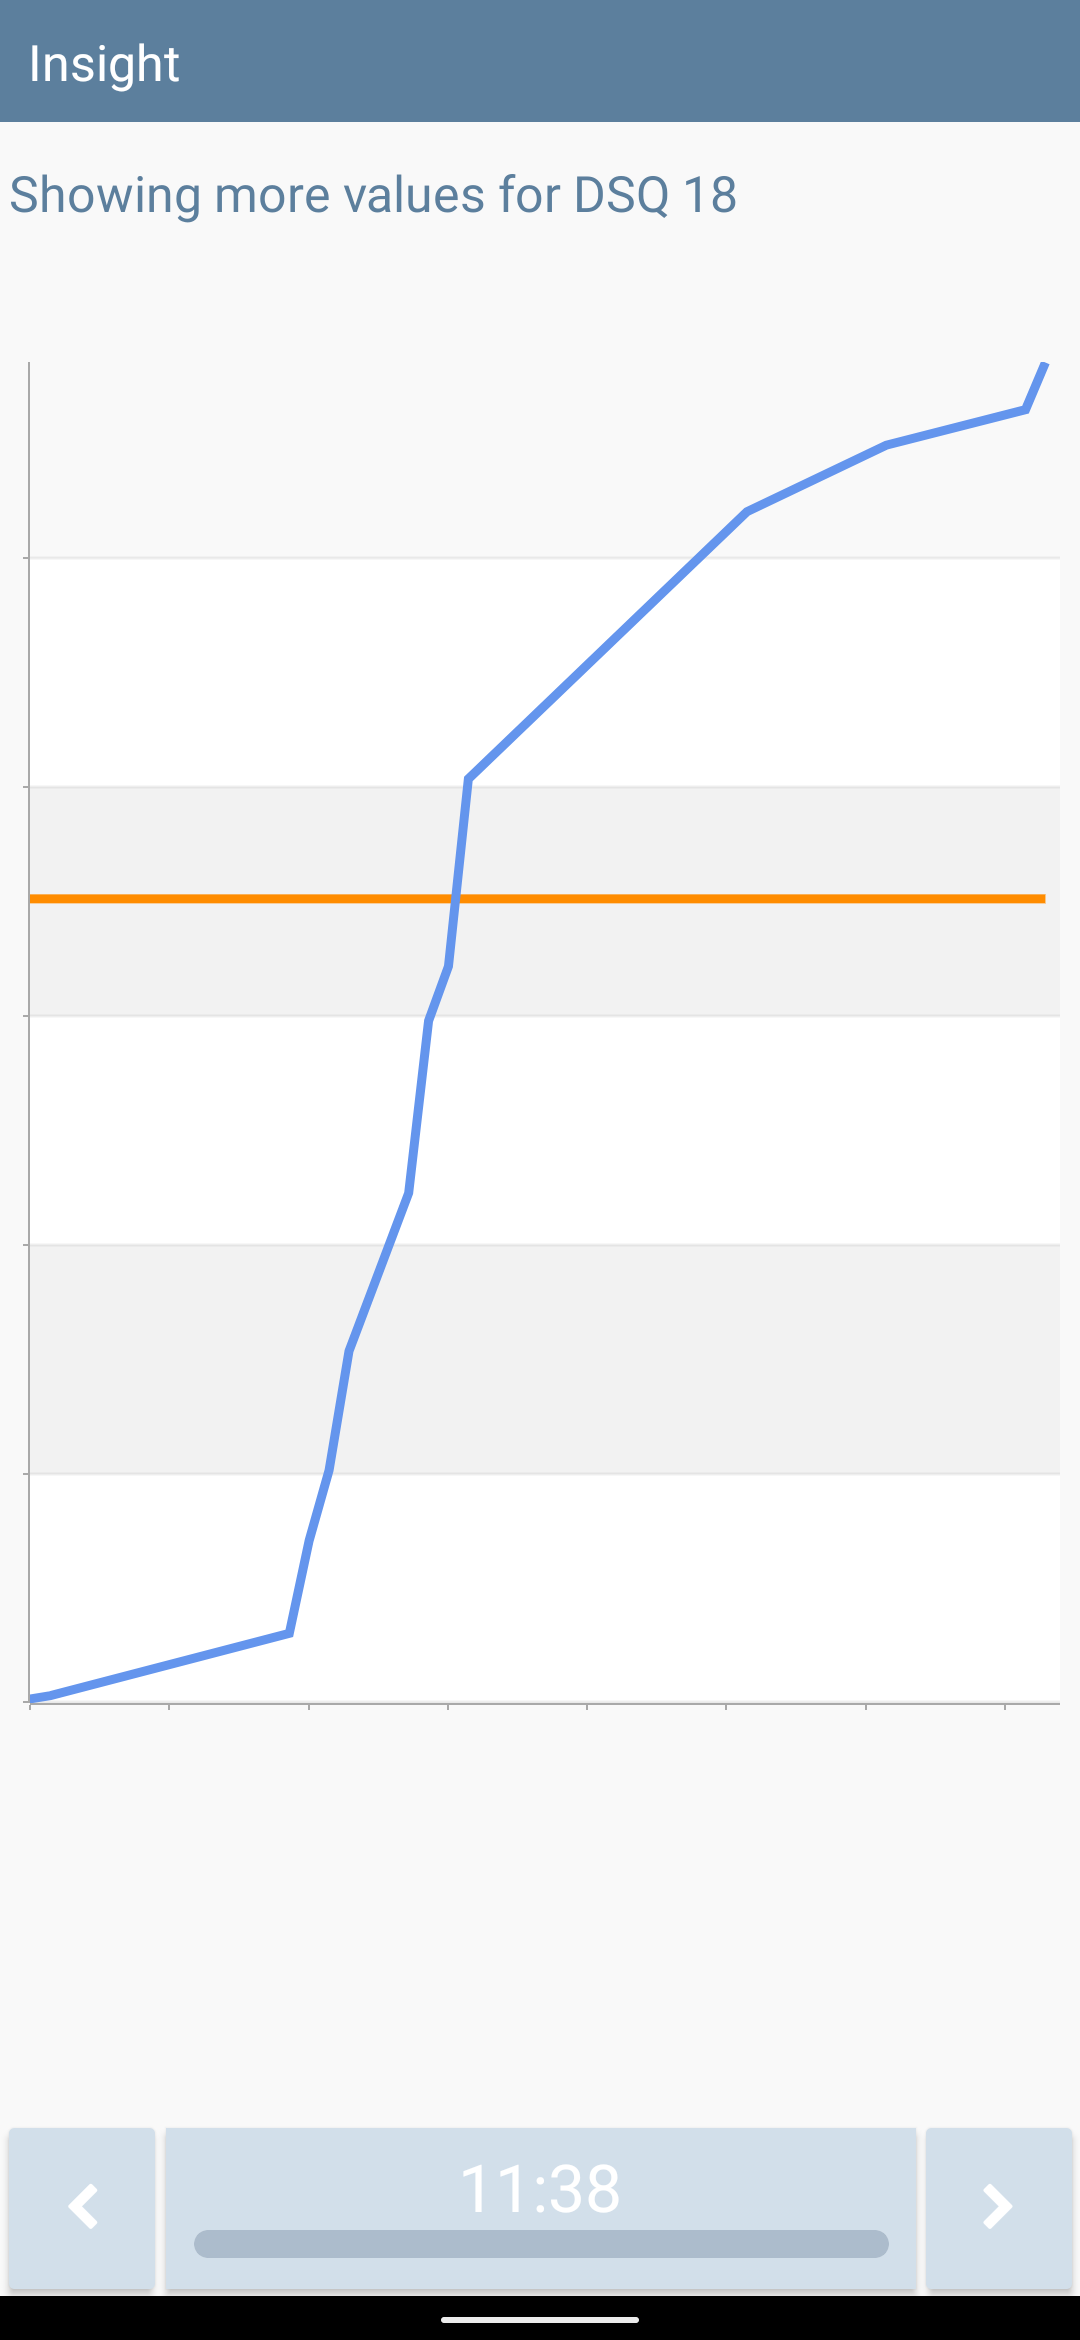
In the CMS, the options for the LineChart appear as shown below. 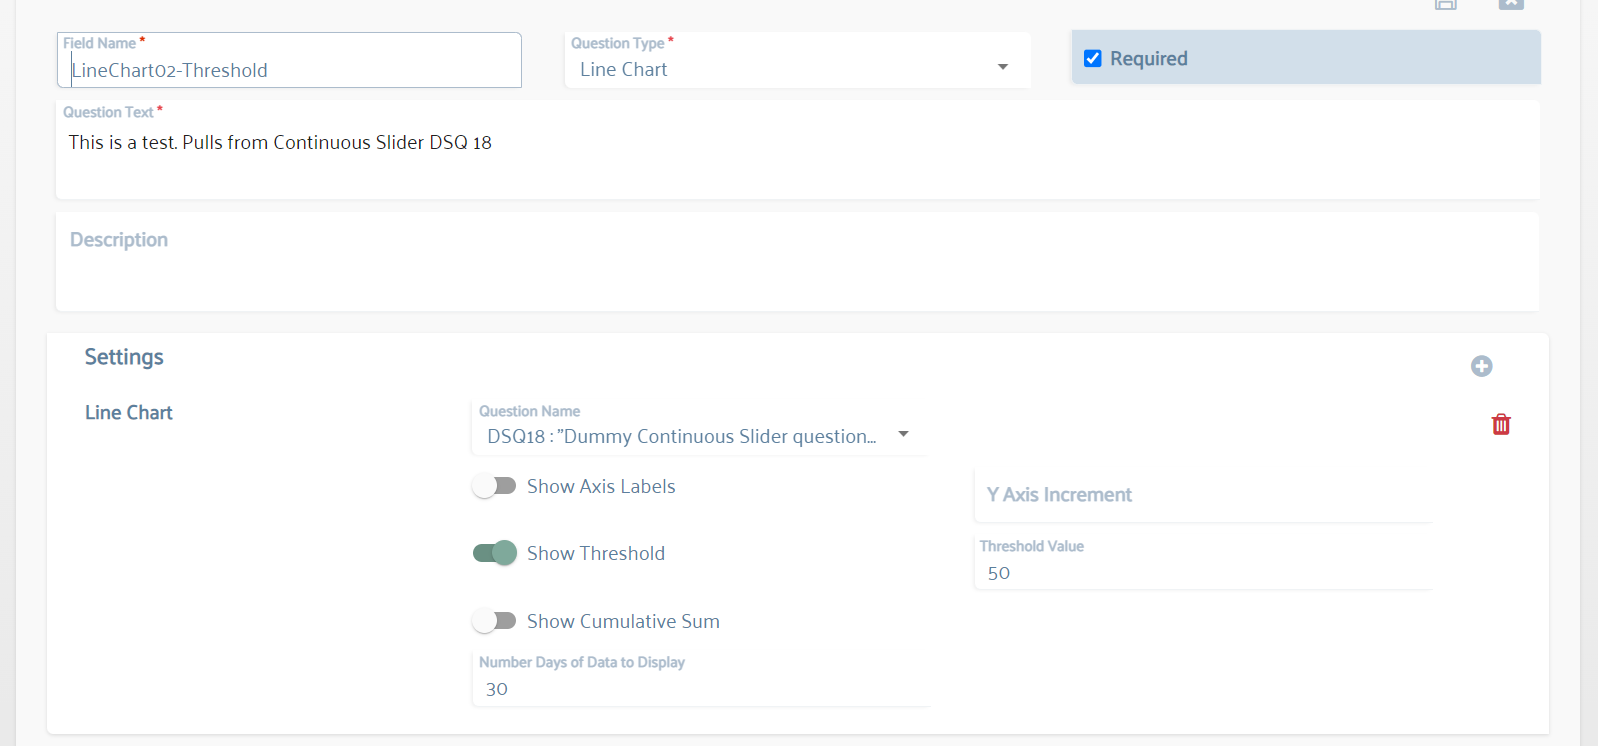 The first option is to select a Question in the Study. The requirement for the LineChart is that the Responses from the Question have numeric values. If they do not, the Line Chart will show an empty graph. Valid Question Types for showing Line Charts data: Radio with numerical Values, Dropdown with numerical Values, Slider, Continuous Slider, BT iCO Breath Sample
The default Line Chart for a Question uses all Responses for the Question over the course of the entire Study. Other options are as follows: Show Axis Labels - This is an Enable / Disable slider. Data Labels will be visible along the Y-axis at fixed increments. Y-Axis Increment Label - A typed-in element of units (such as “Drinks“ or “ppm“) will be added to the Y-axis increments if “Show Axis Labels“ is enabled. Does not show if “show Axis Labels“ is Disabled. Show Threshold - sets a second line on the graph at a fixed Y-value. Displays the graph data value overlaid the Threshold value. If the Threshold is significantly higher than the highest point of Data, the graph is stretched vertically to show both the data and the Threshold. Threshold Value - If “Show Threshold“ is Enabled, this is a number input for the Threshold Value to be rendered against the data values from the selected Question. Show Cumulative Sum - The Linear Chart is able to show a linear sum of Question Data over multiple days, as opposed to showing a linear plot of data. Each Response value is summed with the previous data point value, starting with just the first point and ending with the Response value from the last Response. Number of Days - Line Charts can designate a number of days to use instead of all Responses over the course of the Study. Inputting a positive number of Days, the displayed Cumulative Sum Line Chart will show the Response Data for the last number of allocated Days. Leaving the Number of Days blank will show all of the Responses over the course of the Study.
|
...
| Expand | ||||||||||||||||||||||||||
|---|---|---|---|---|---|---|---|---|---|---|---|---|---|---|---|---|---|---|---|---|---|---|---|---|---|---|
| ||||||||||||||||||||||||||
1. Download Wear OS from the Google Play Store
|
| Status | ||||
|---|---|---|---|---|
|
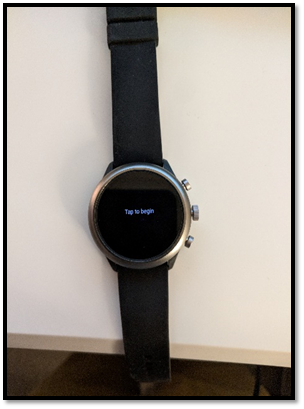
Tap on the watch screen when it says Tap to begin
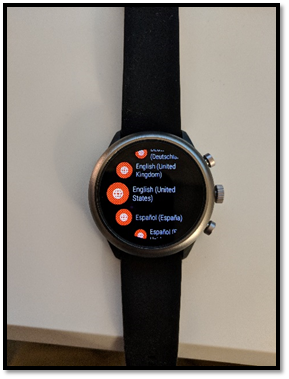
Select English (United States) as your language
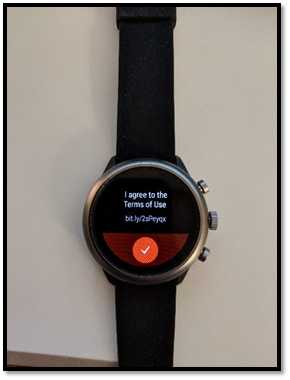
Press the check mark to agree to the Terms of Use
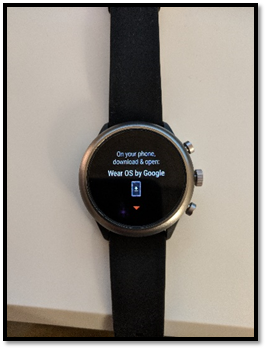
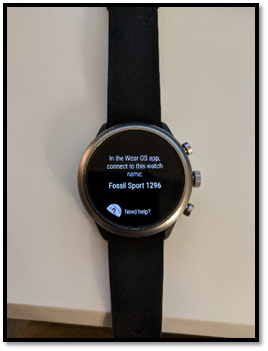
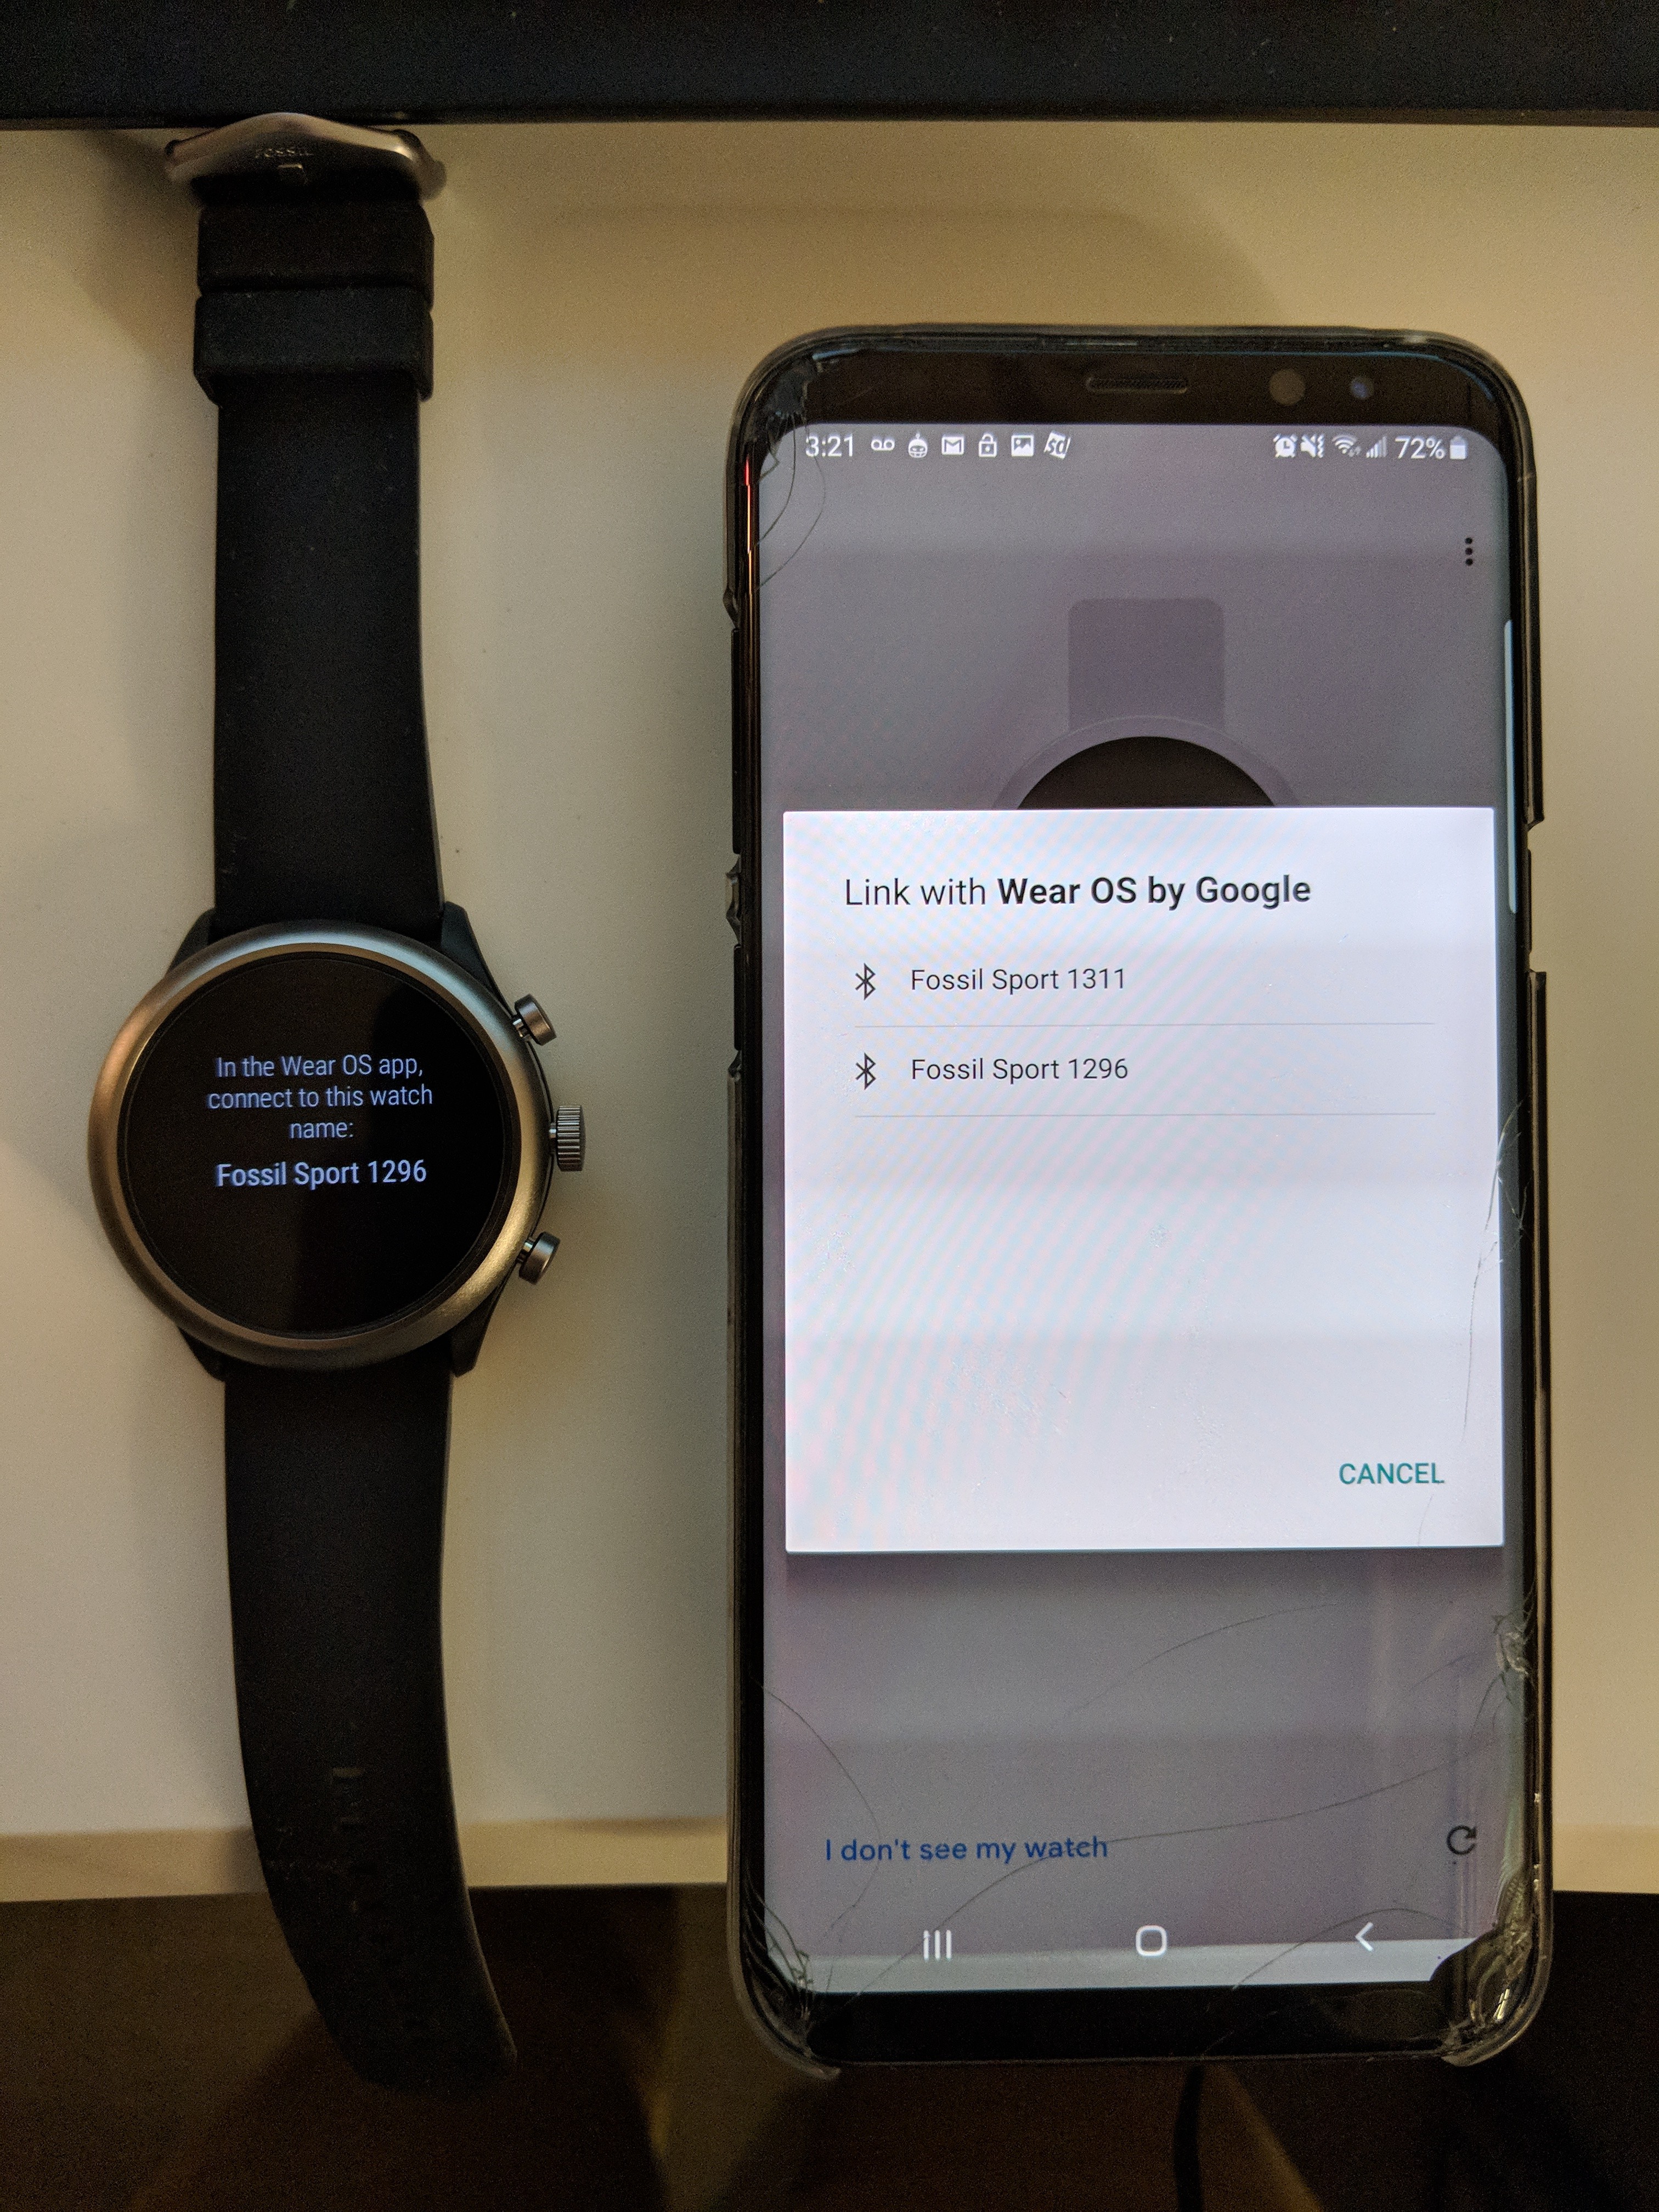
The watch will then prompt you to open the Wear OS app on your phone. Scroll down and you’ll see the watch name. Take note of the watch name as you’ll use this as a reference to it later during the phone setup.
| Status | ||||
|---|---|---|---|---|
|
Press Start Setup
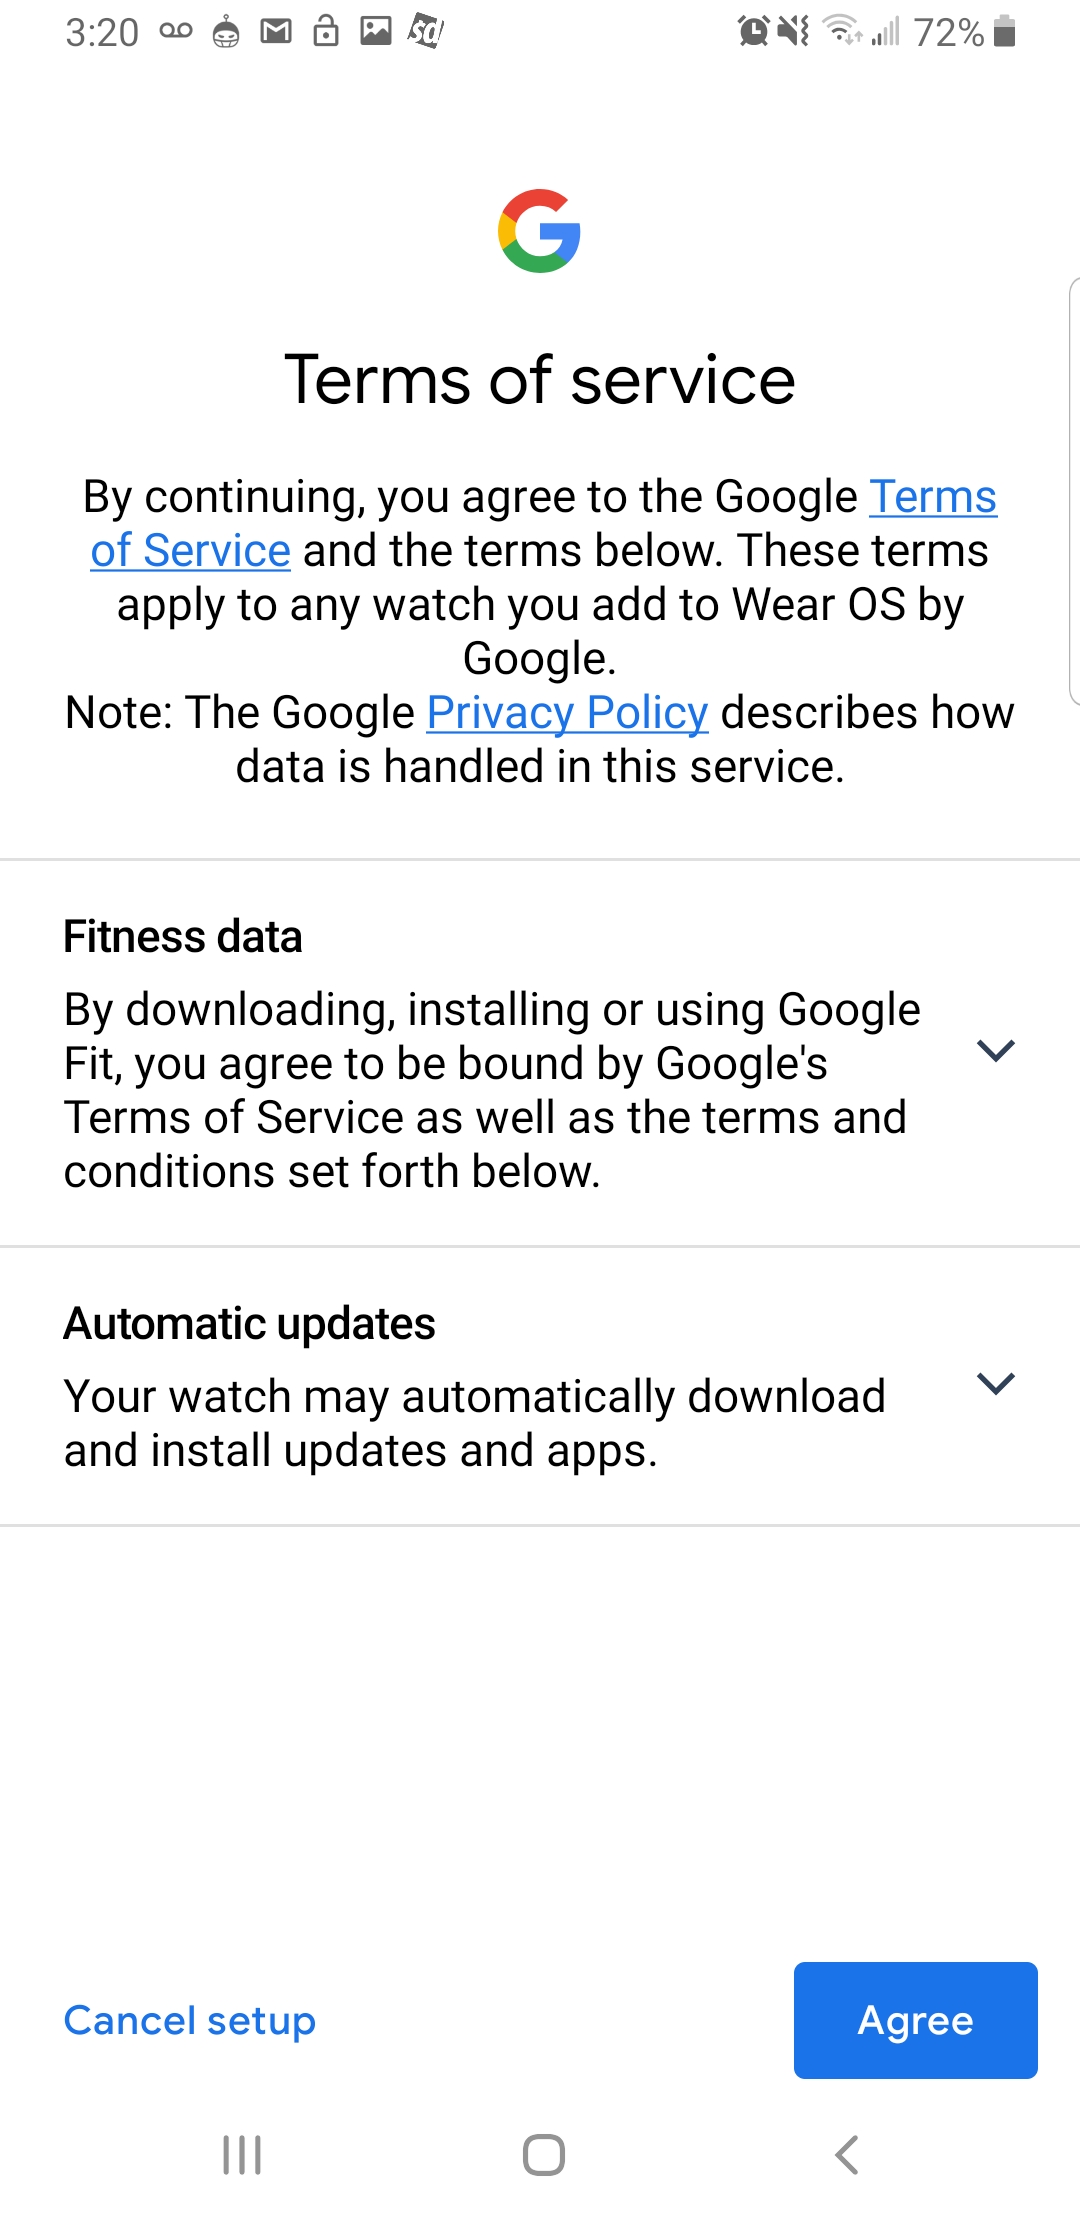
Press Agree for Terms of Service
Press Agree for Make Wear OS better
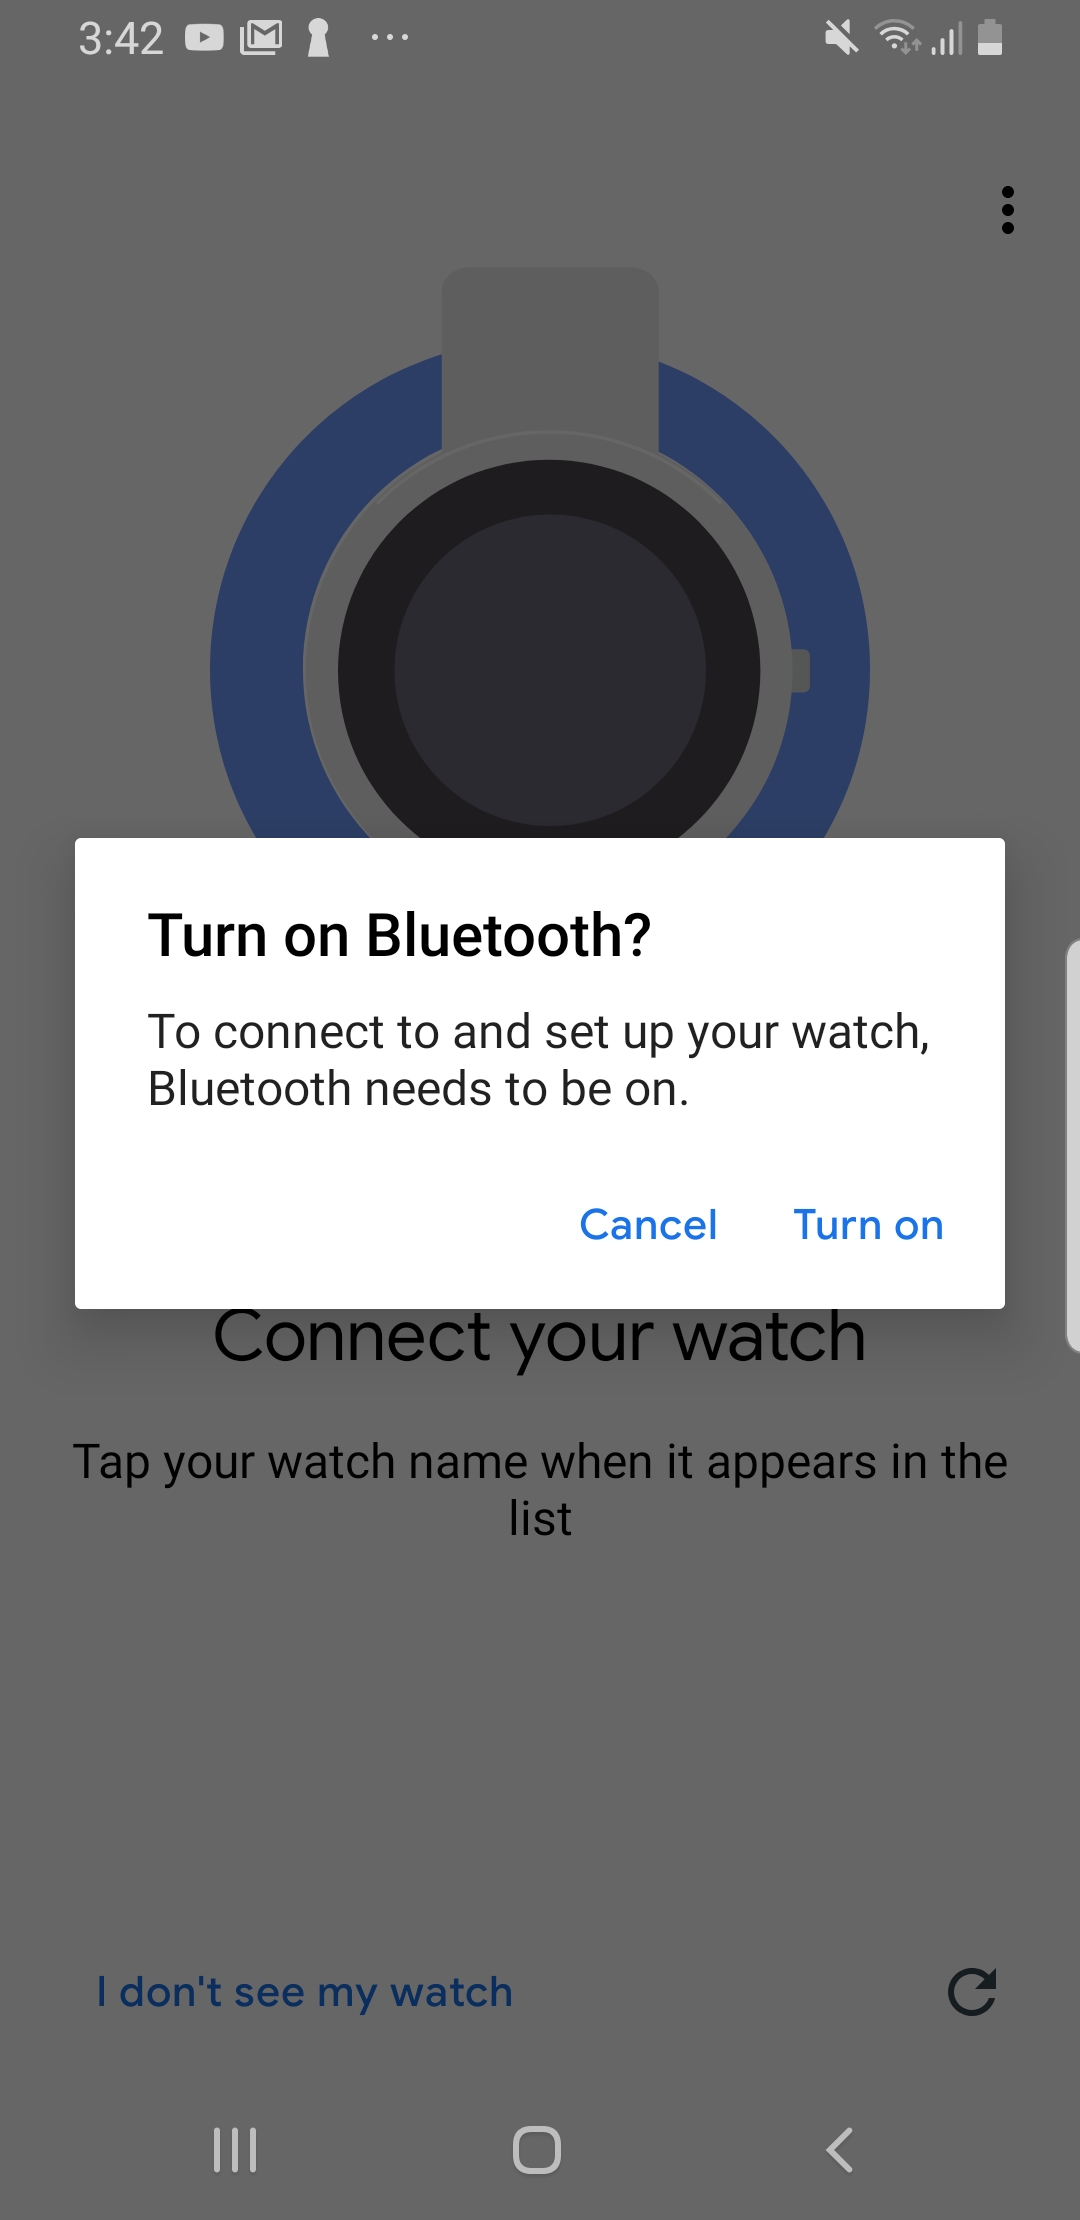
The phone will then attempt to link with your watch. Turn on Bluetooth if the phone prompts you to turn it on.
Match the watch name seen on the watch with the watch name on the phone and click on it.
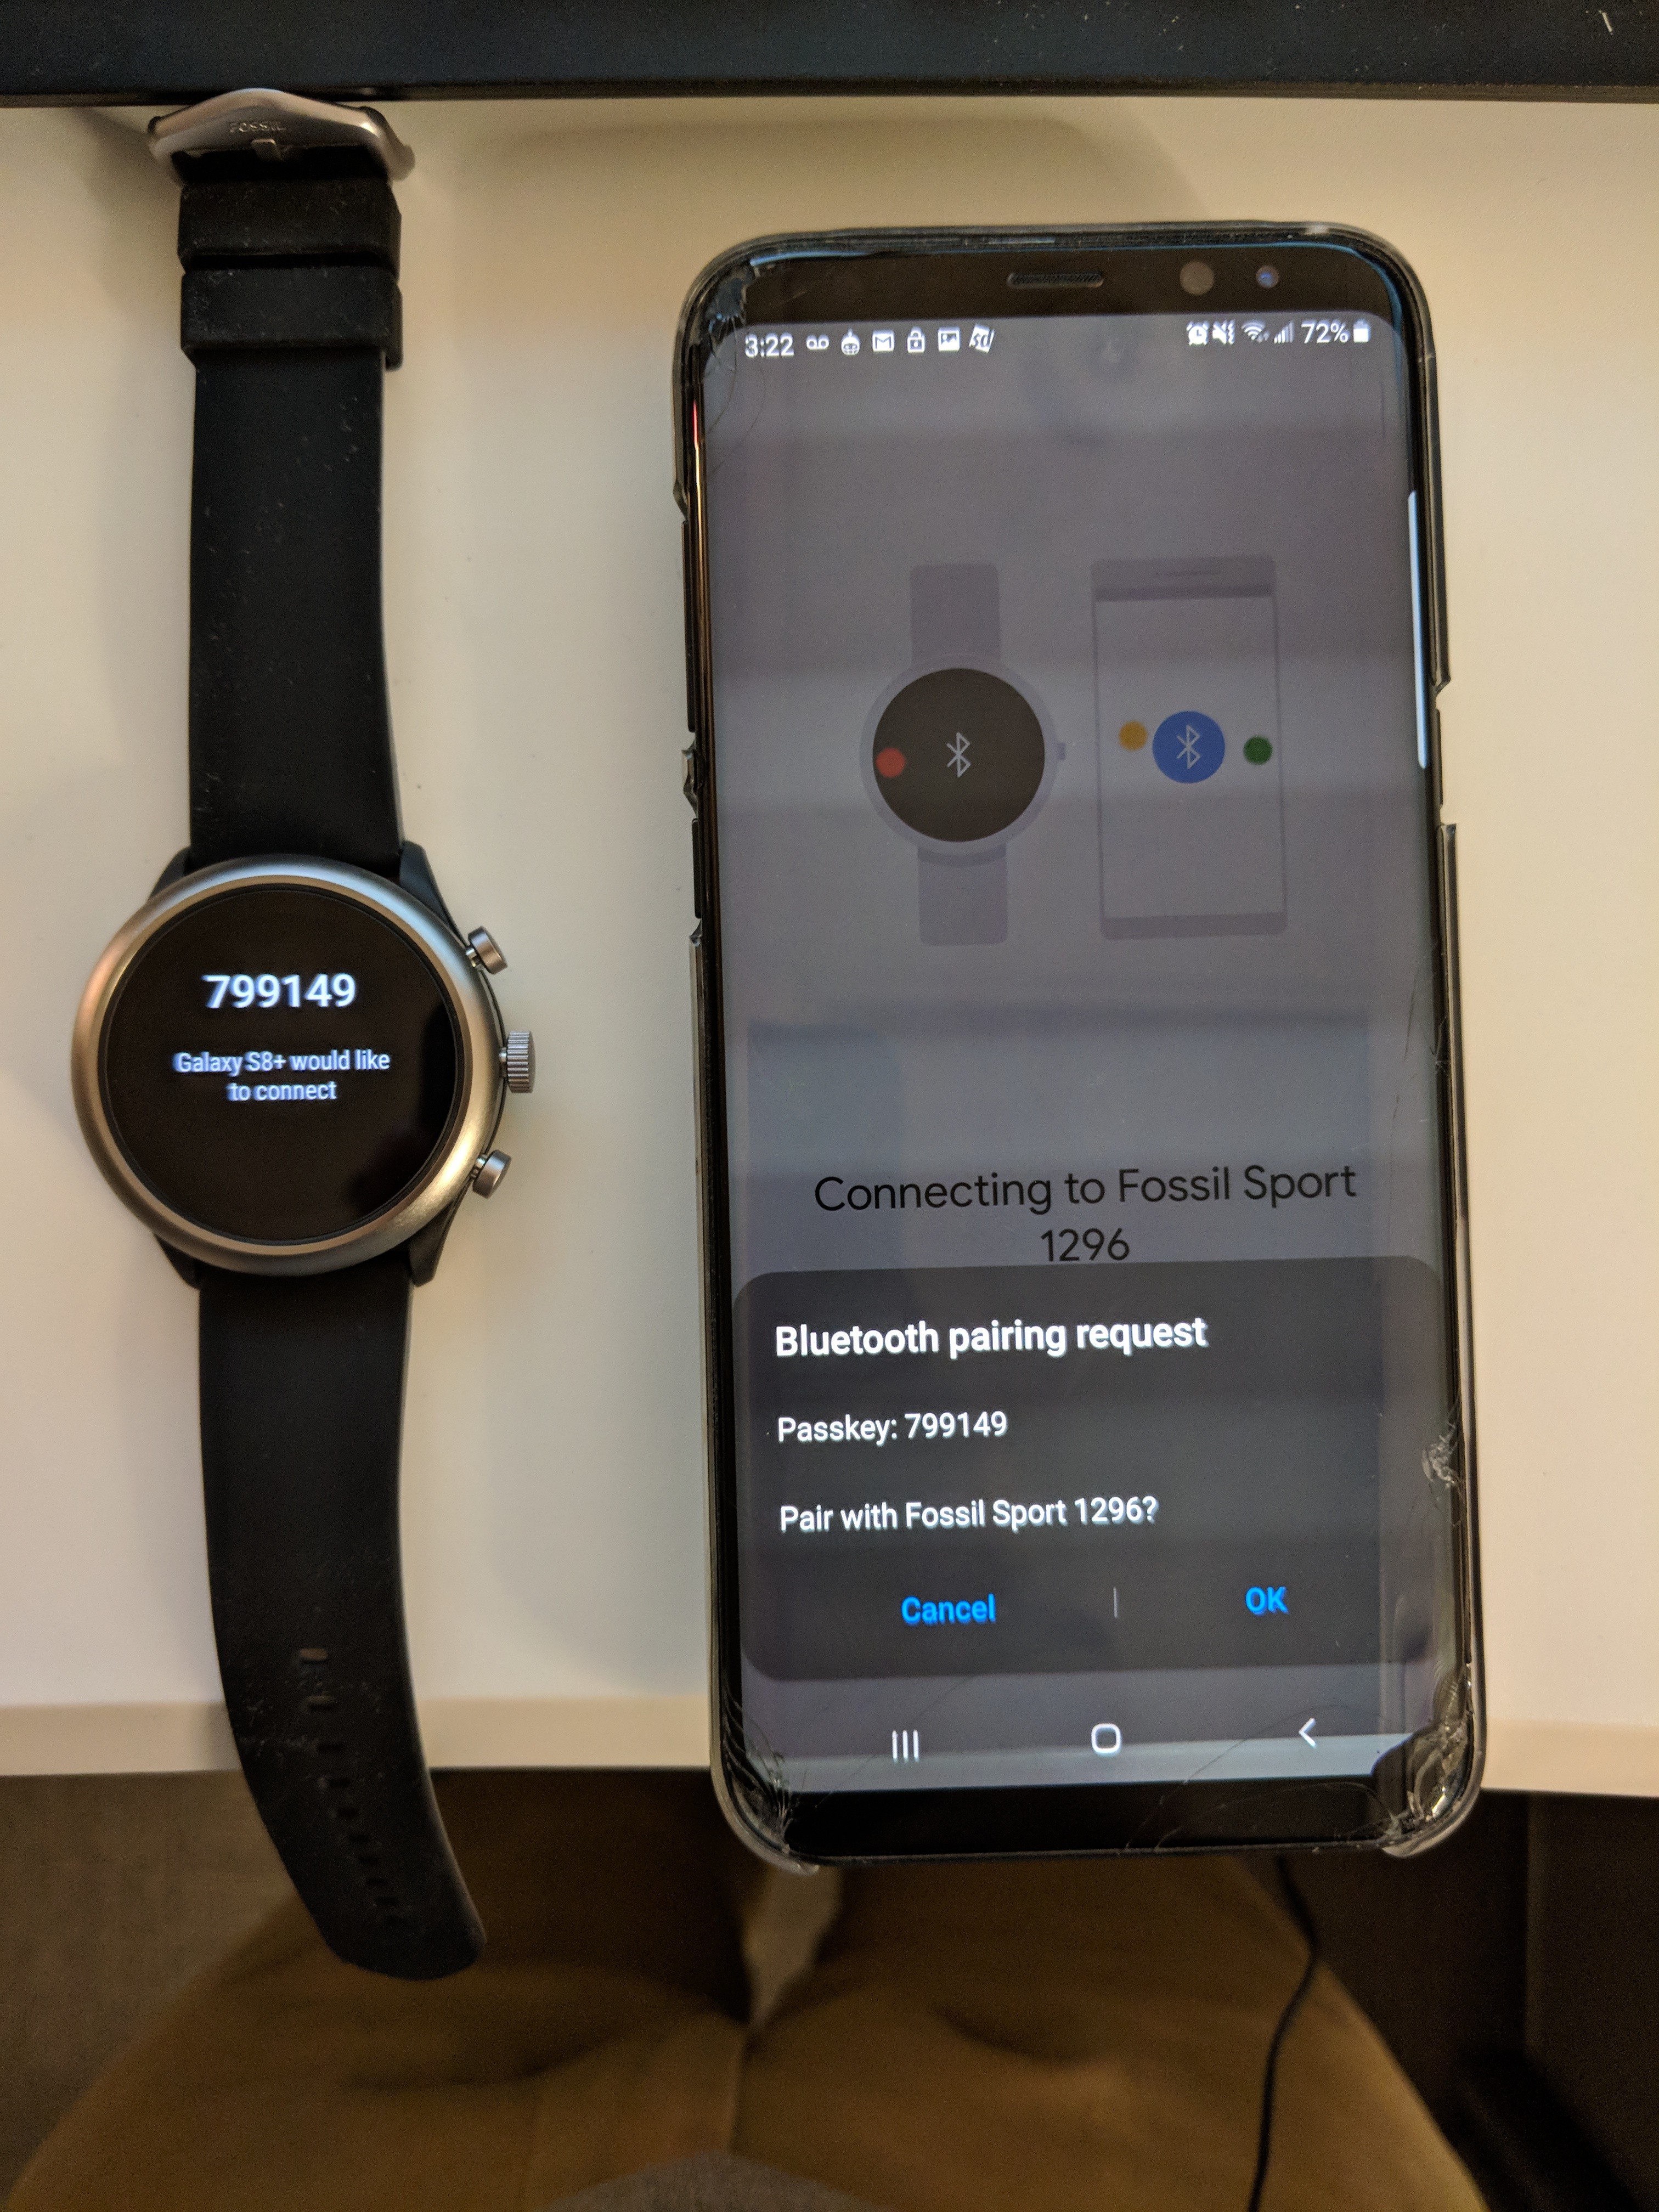
A pass key will appear on the watch. Make sure it matches the one on your phone and press
OK to pair the phone with the watch.
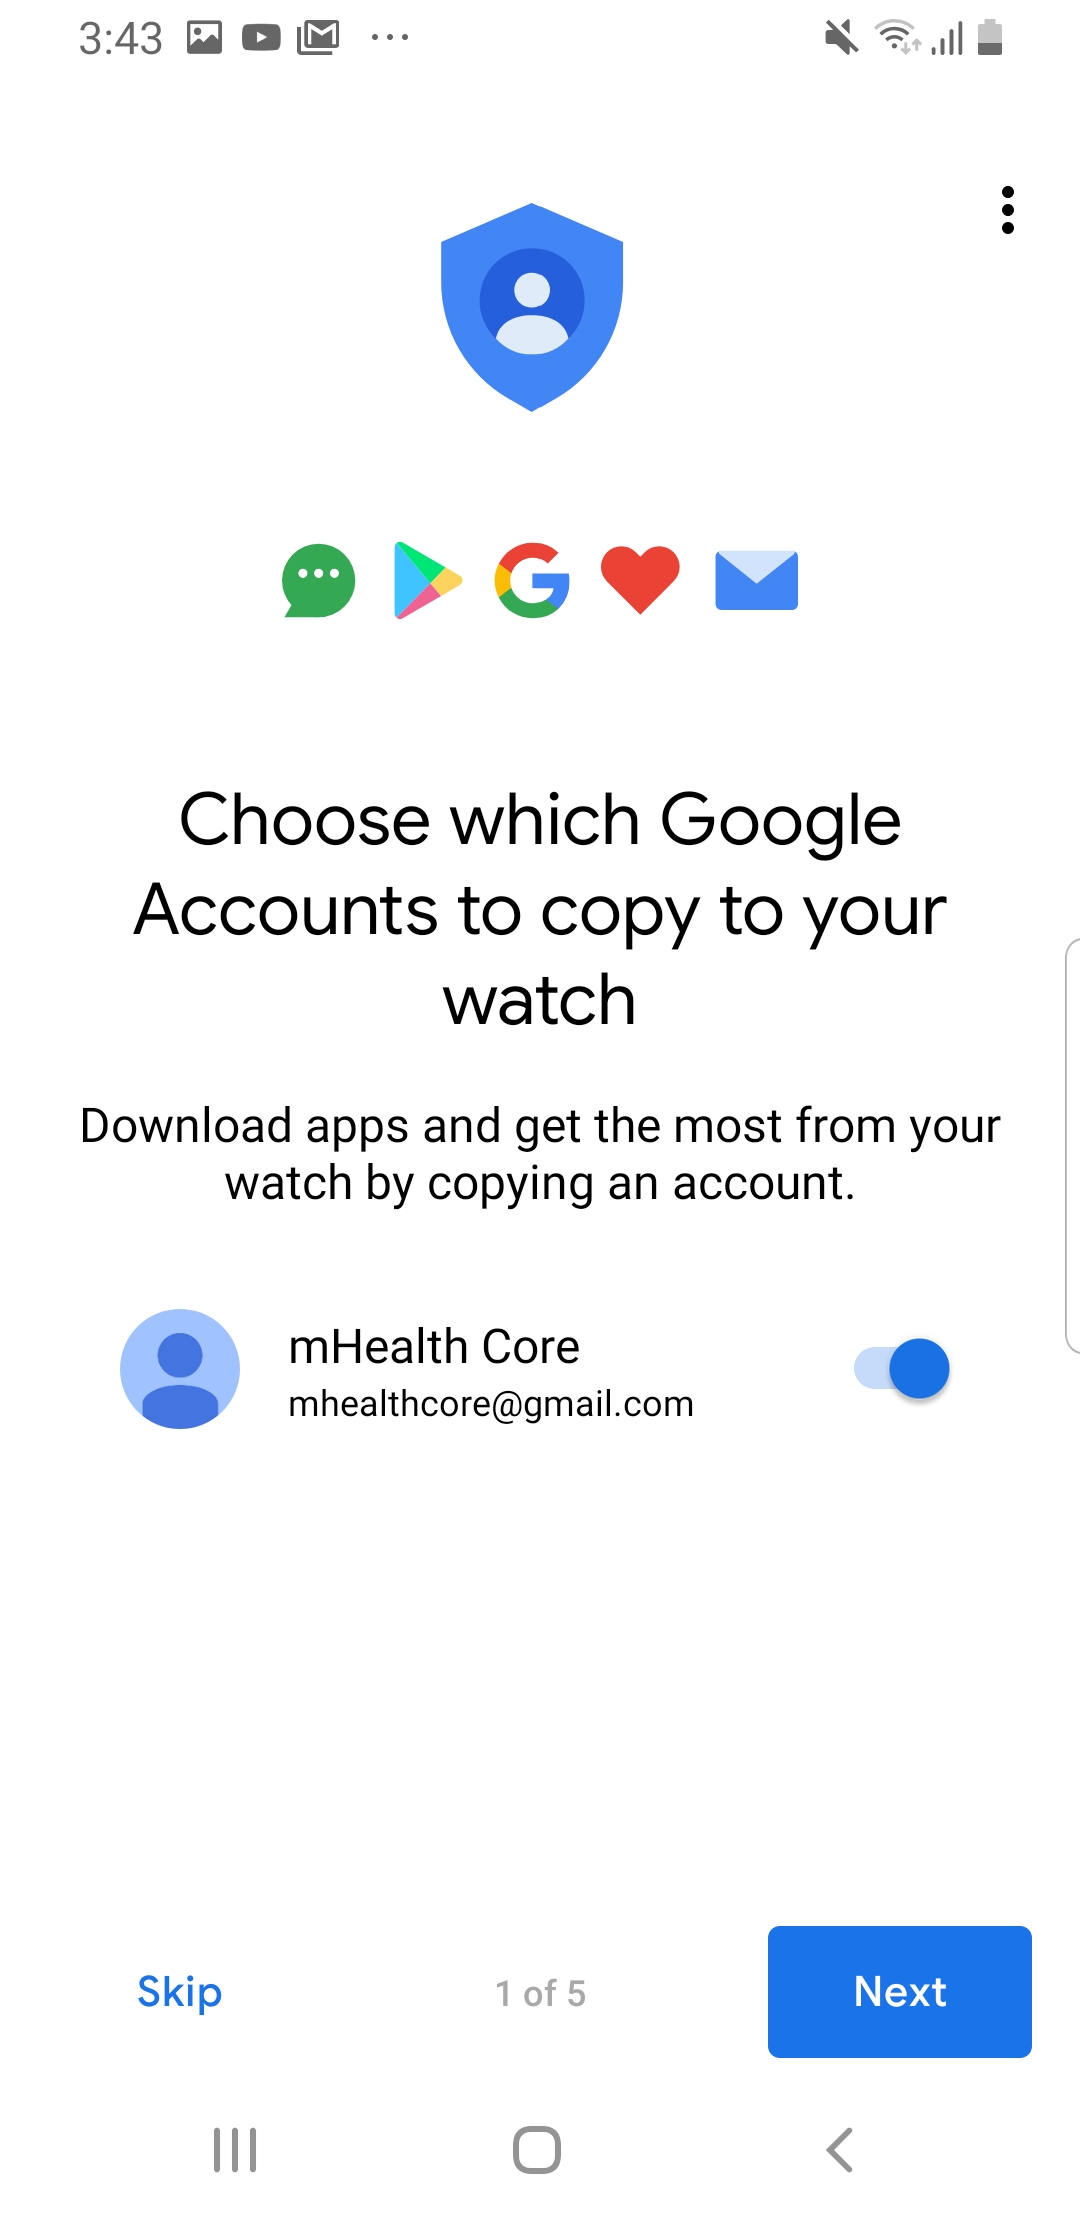
Under Choose which Google Accounts to copy to your watch, make sure the slider is on (slider will be blue if it’s set to on) next to the participant’s google account. Click on Next
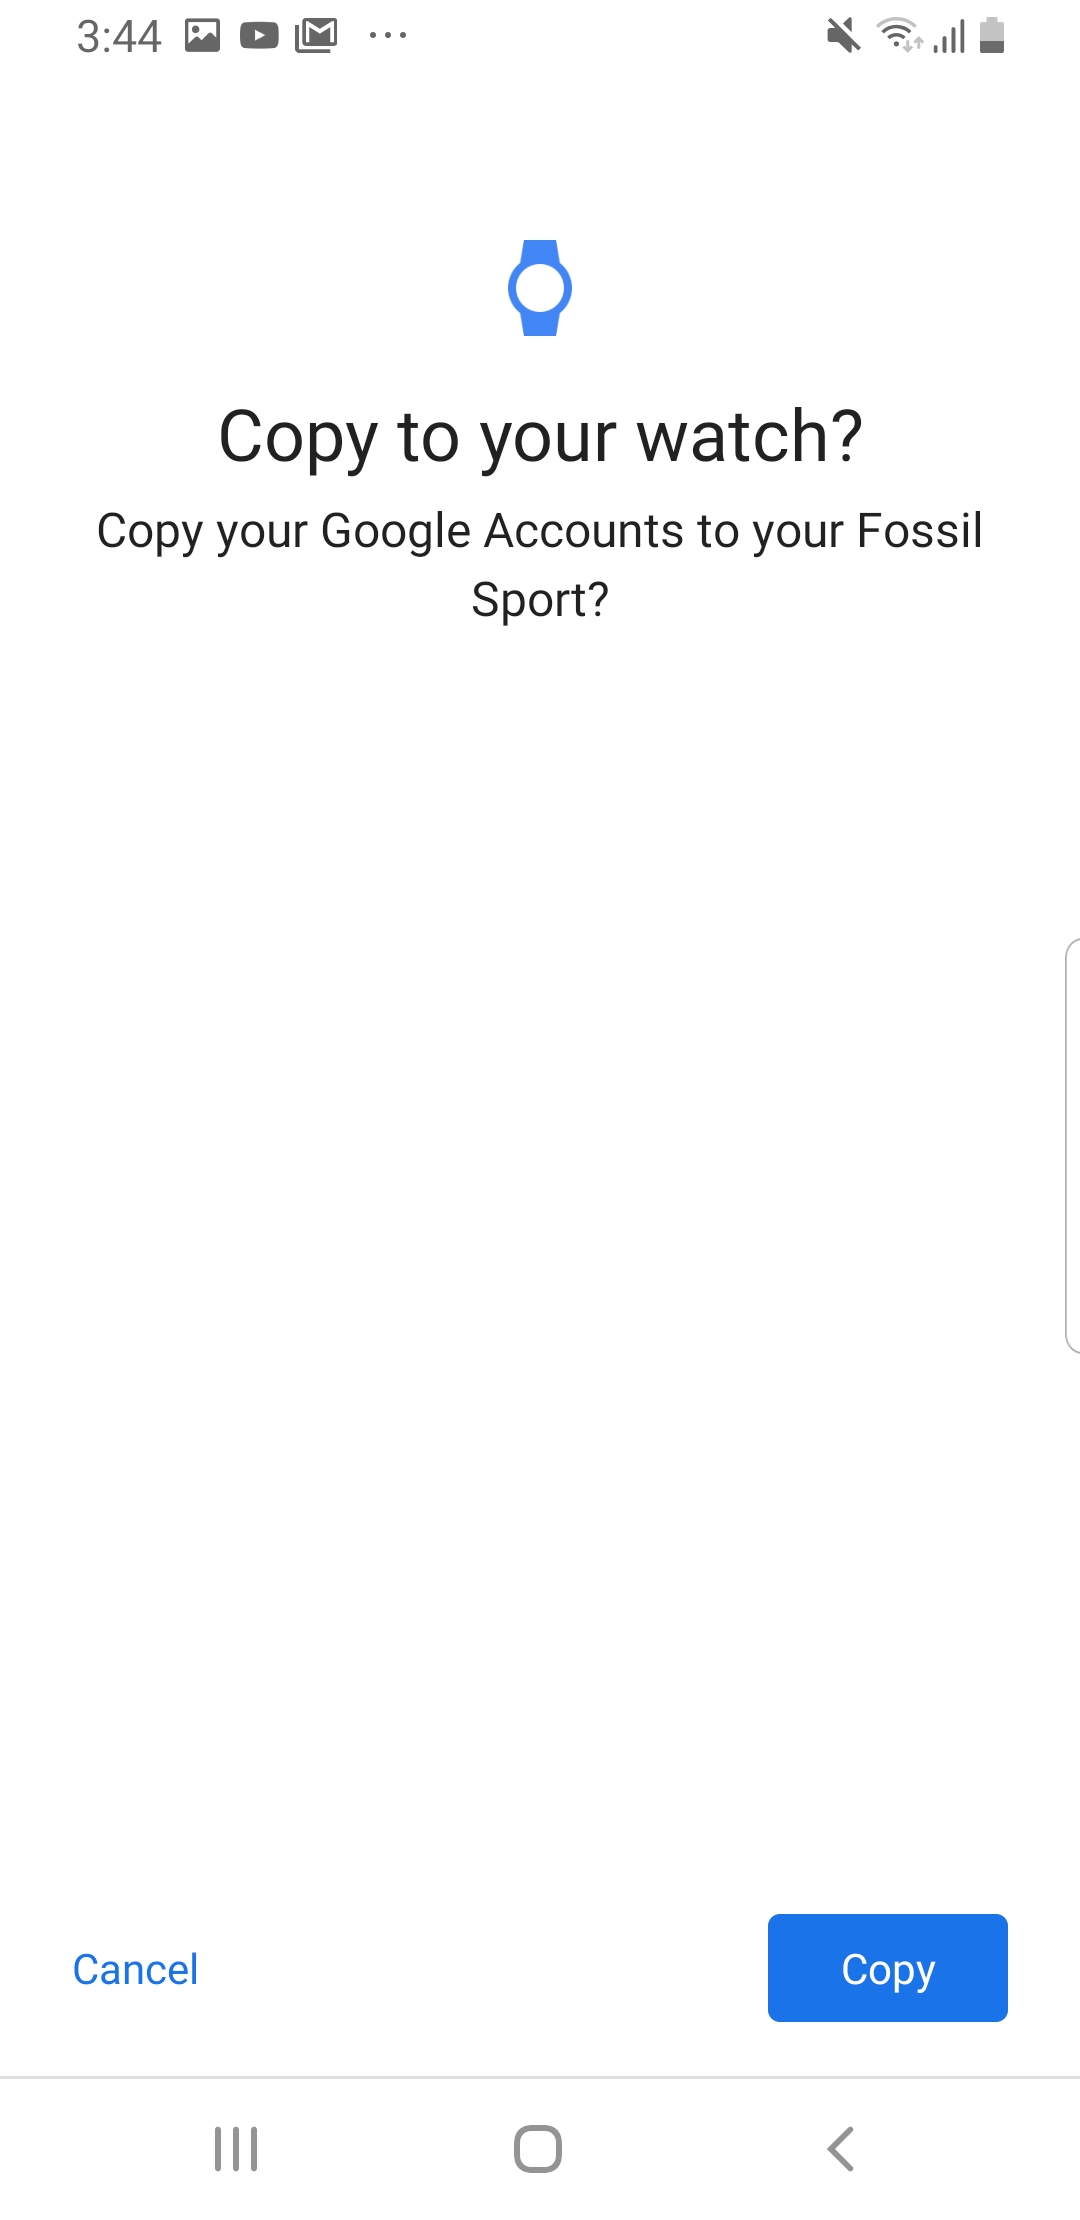
Press Copy to copy the google account to the watch
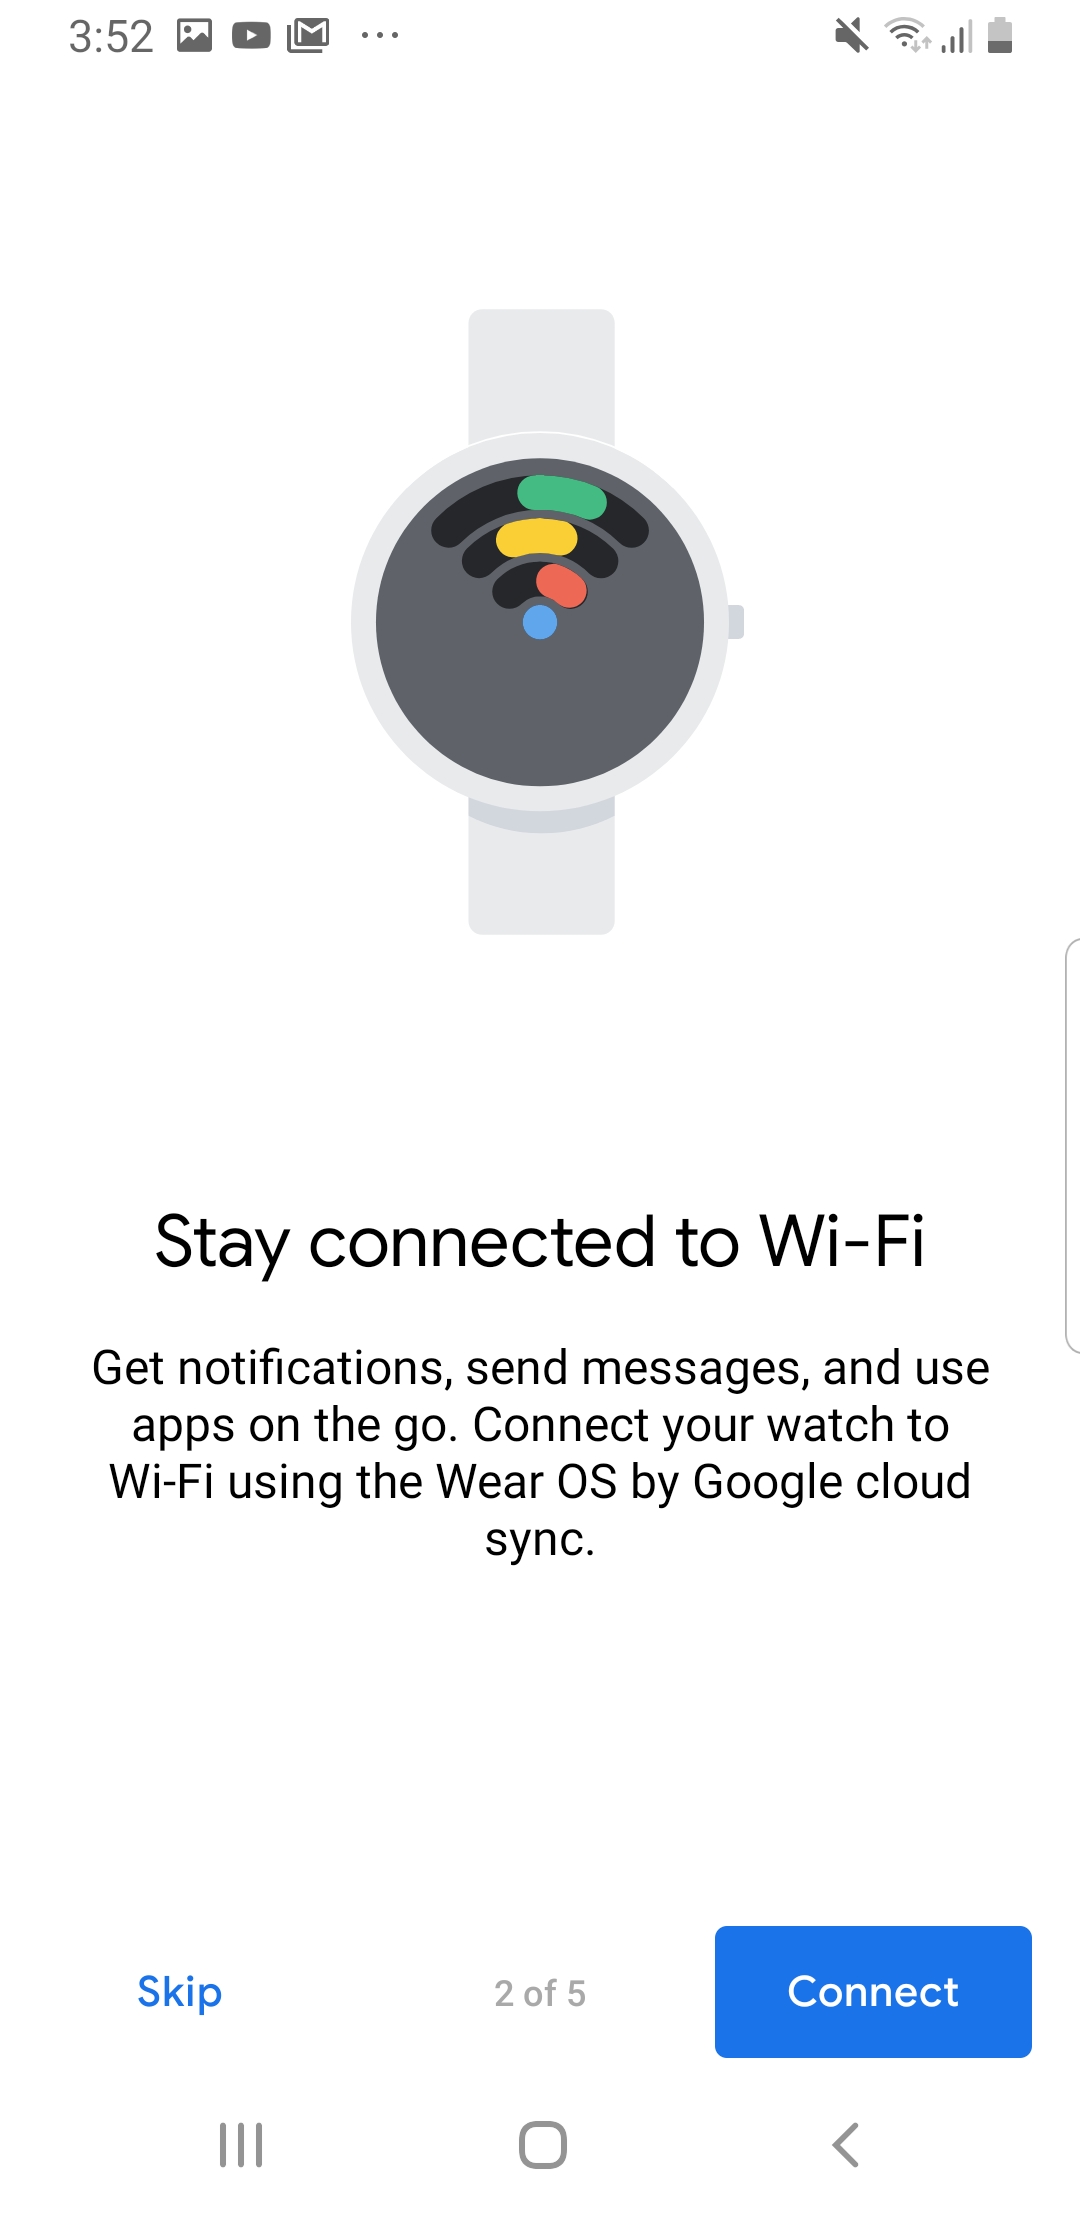
Under Stay connected to Wi-Fi, press Connect
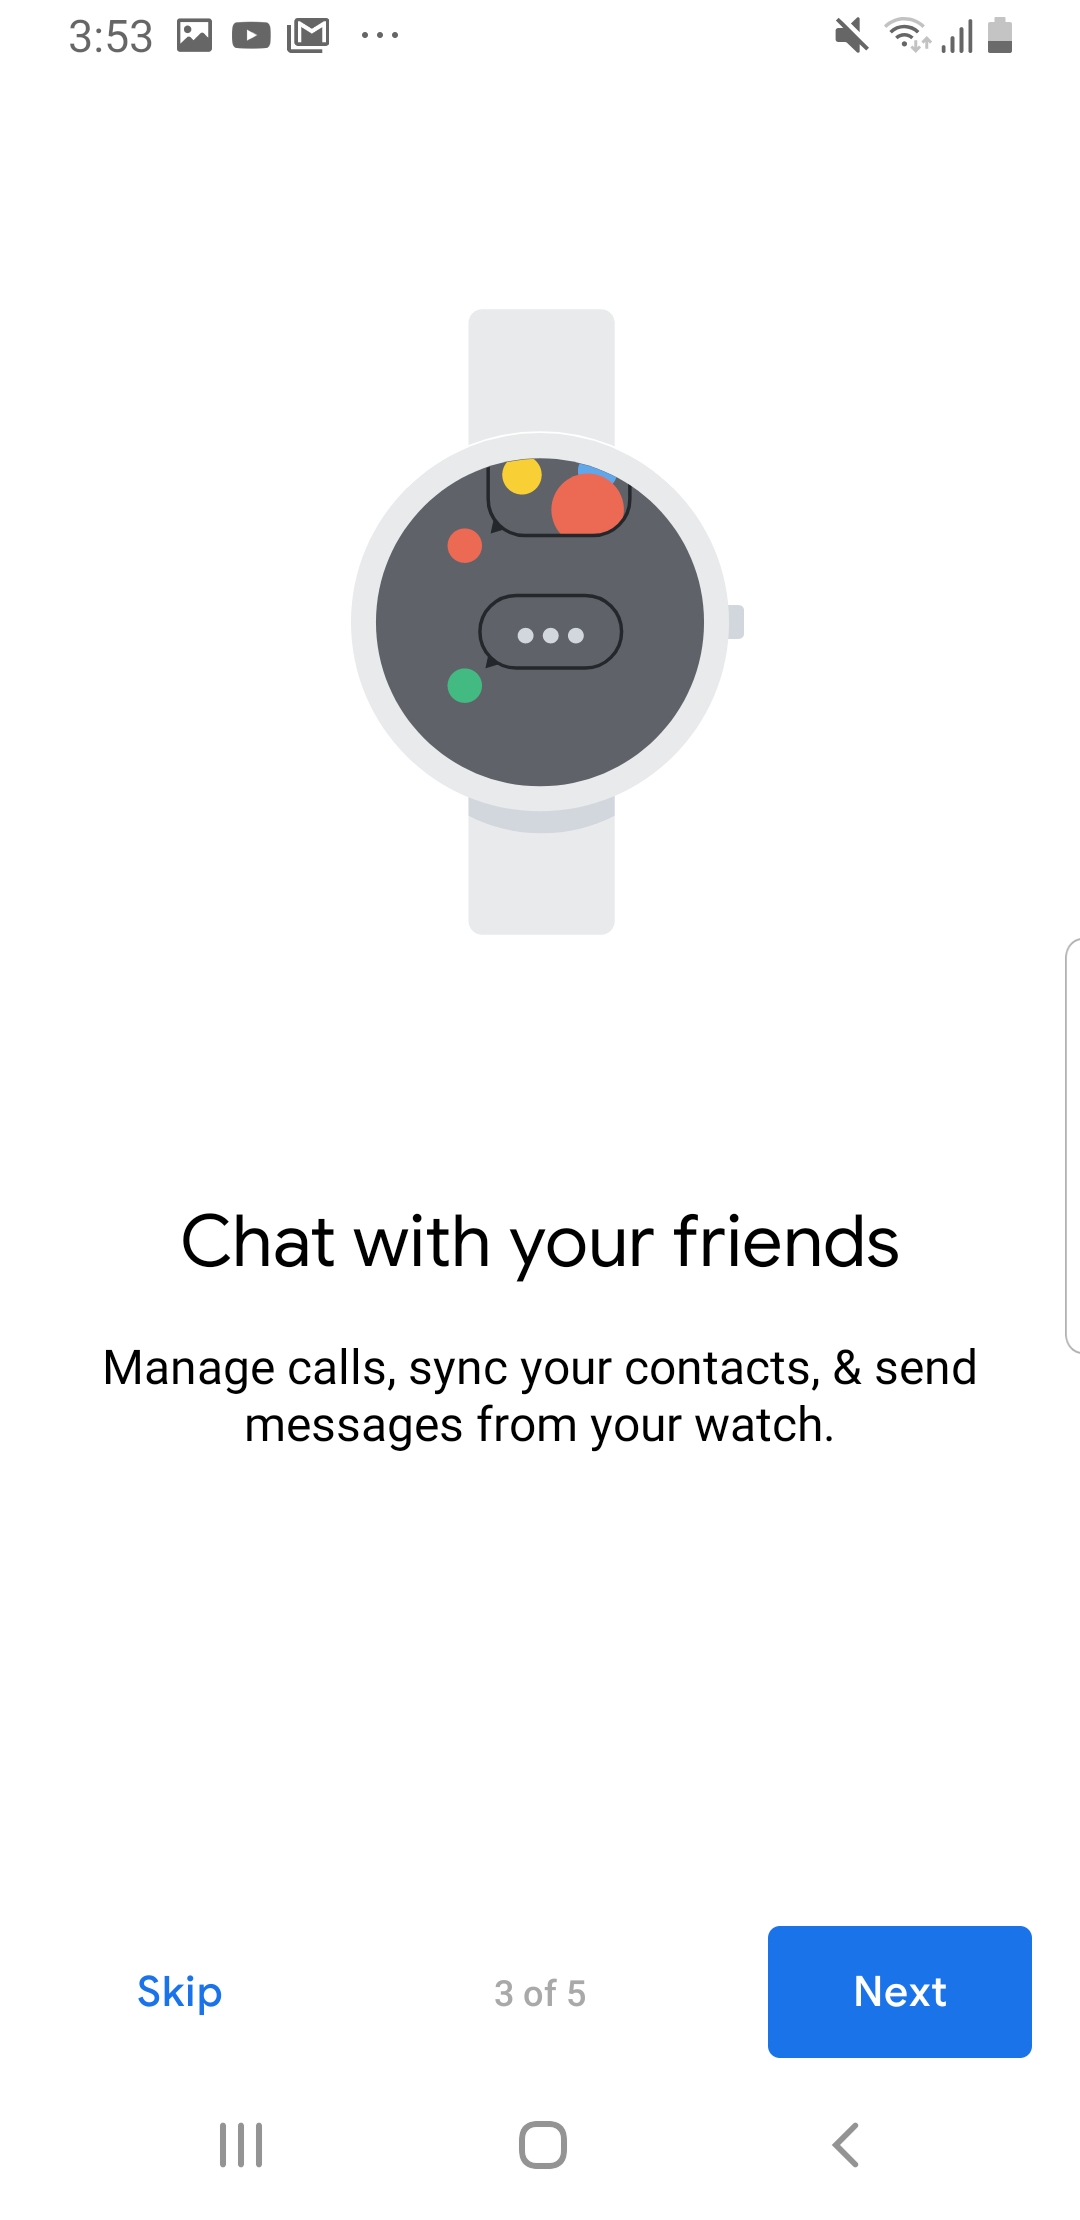
10. Press Next under Chat with your friends
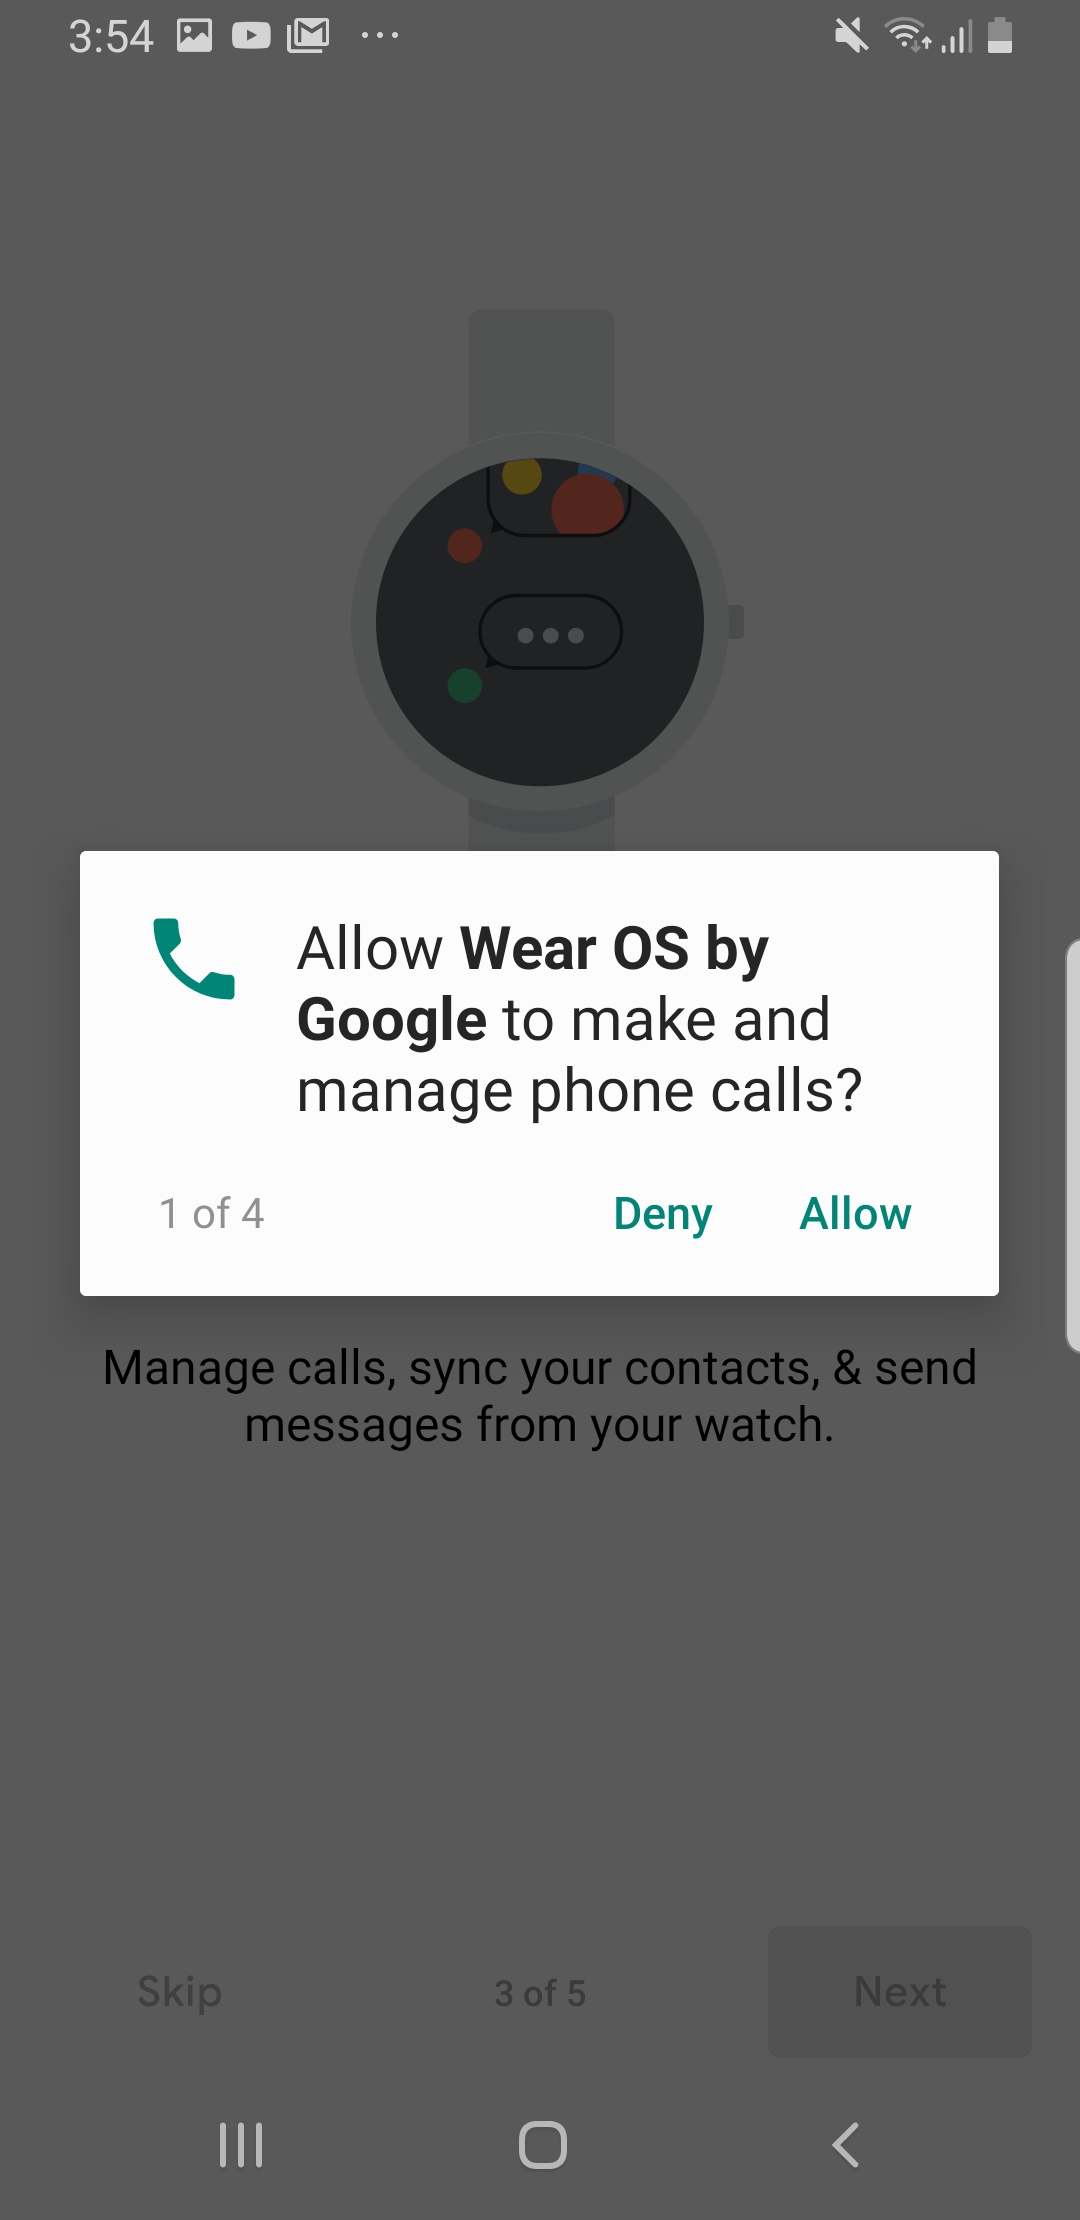
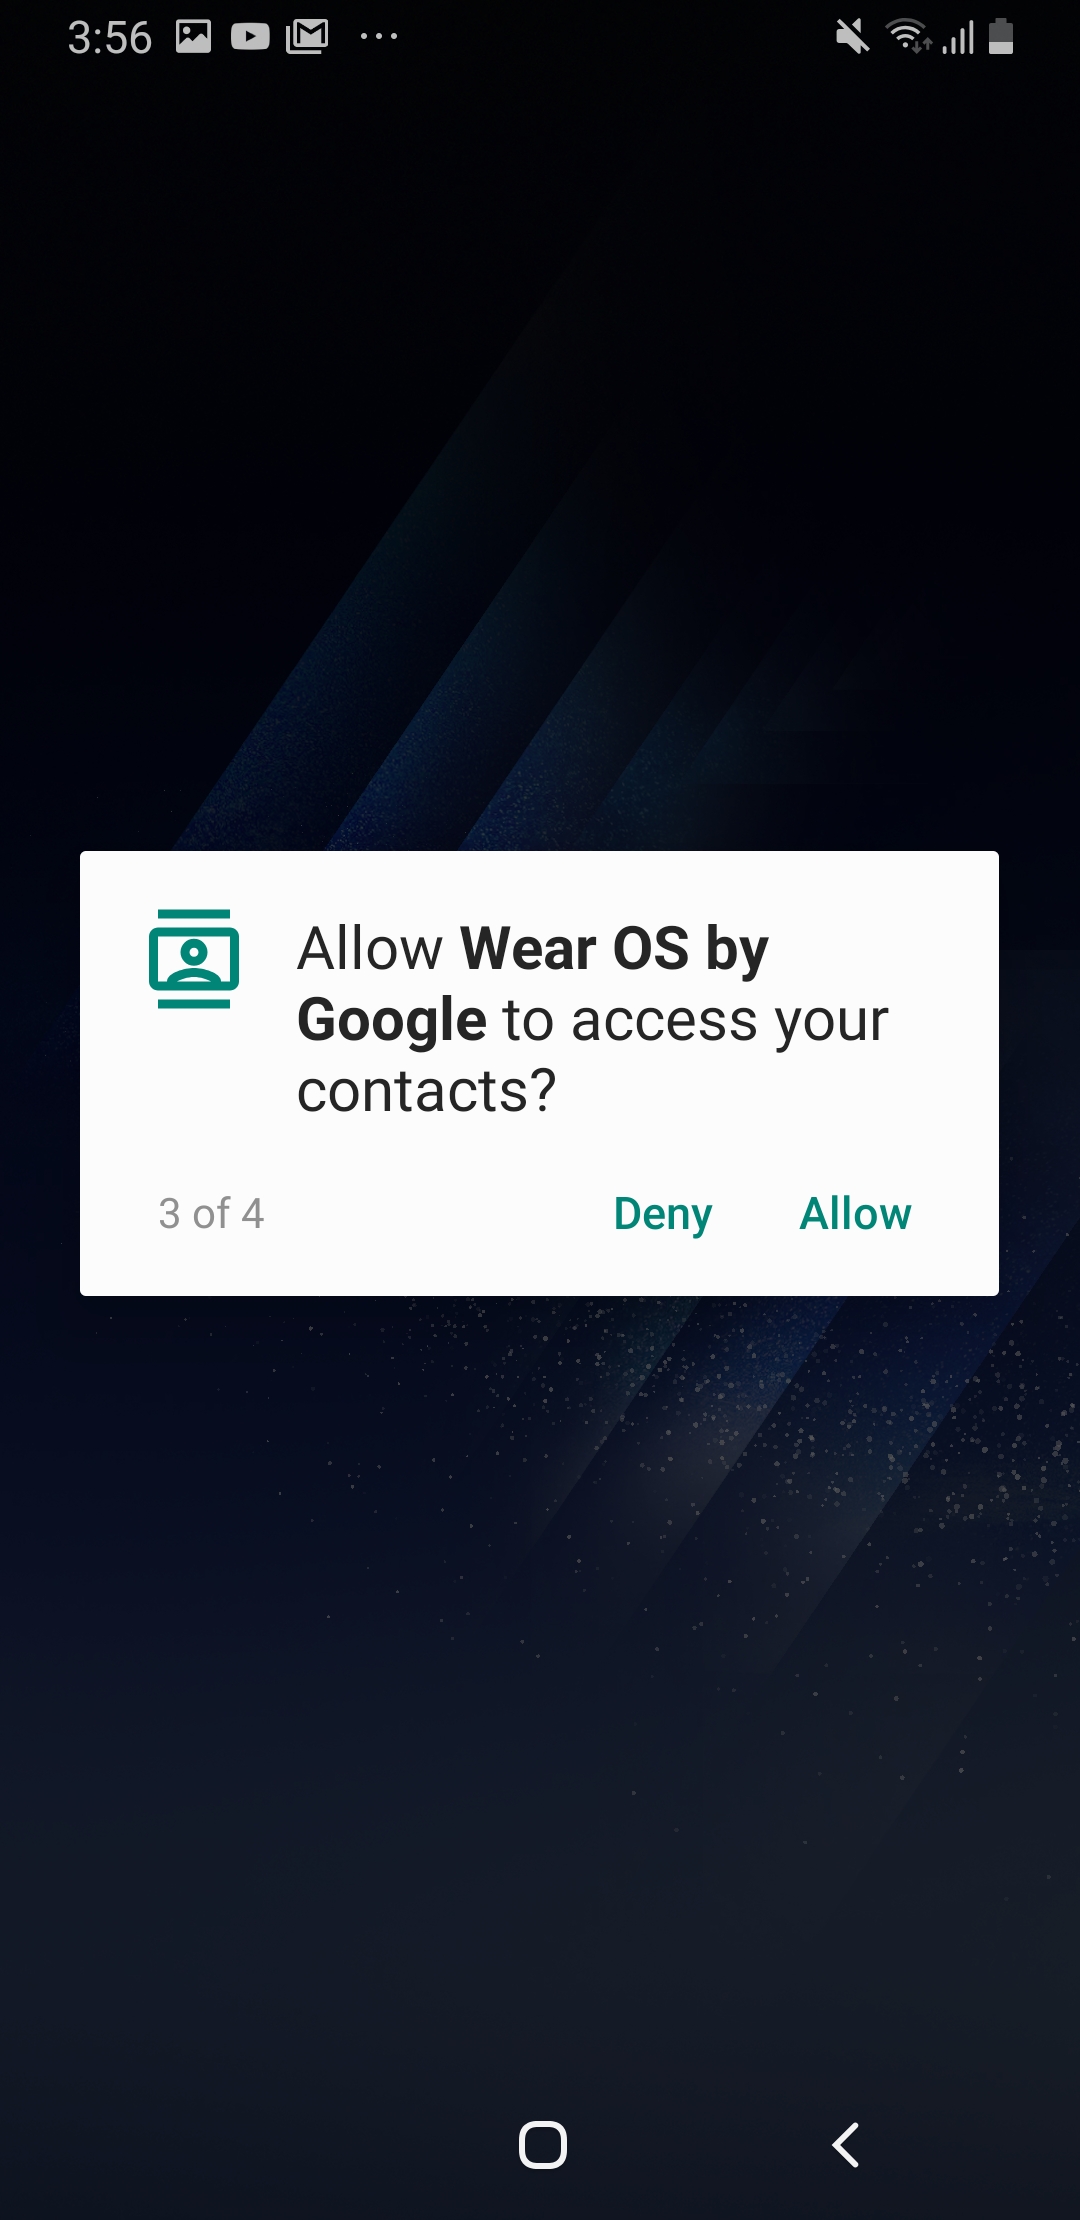
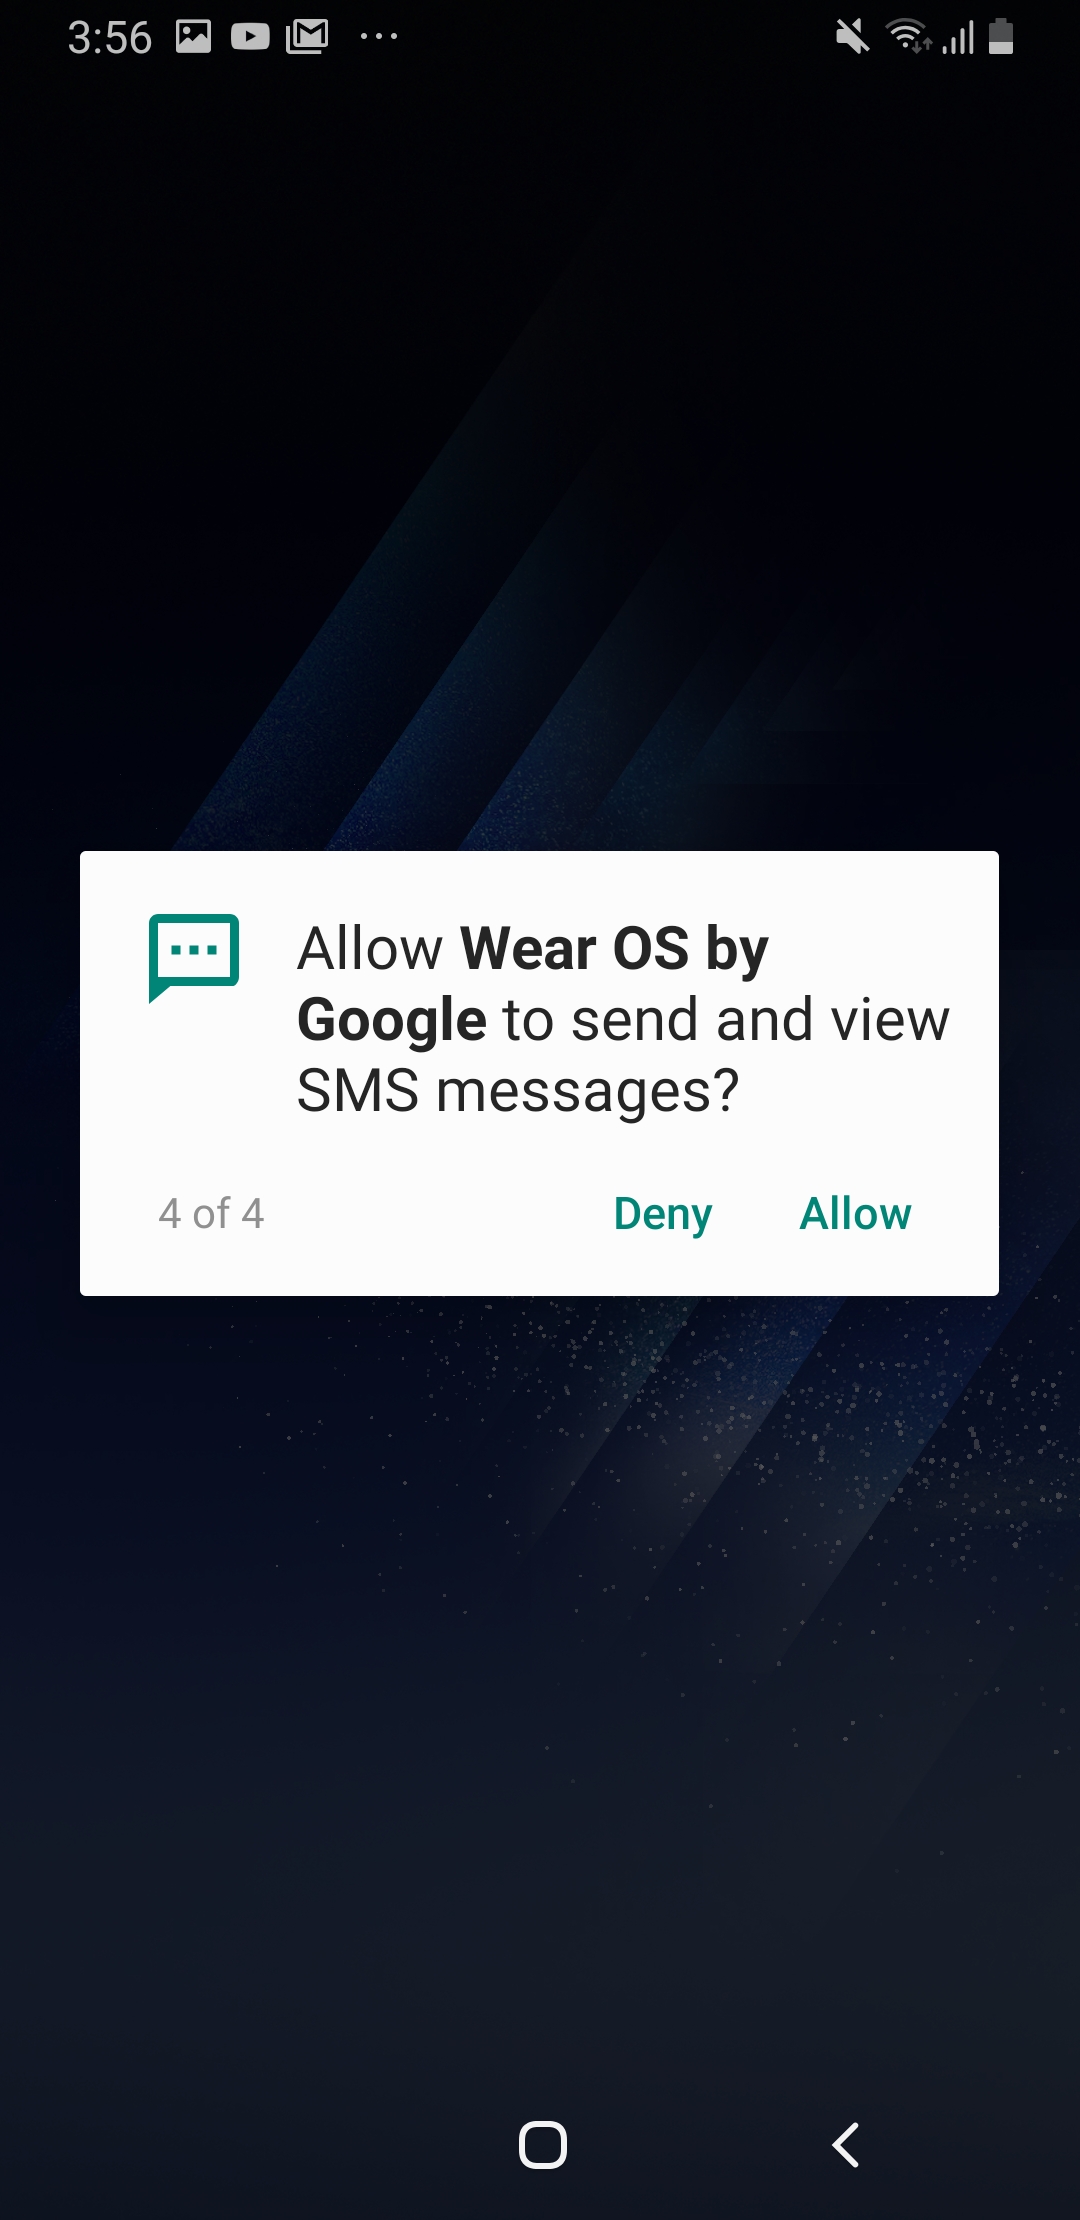
11. Press Allow for all 4 of the permissions.
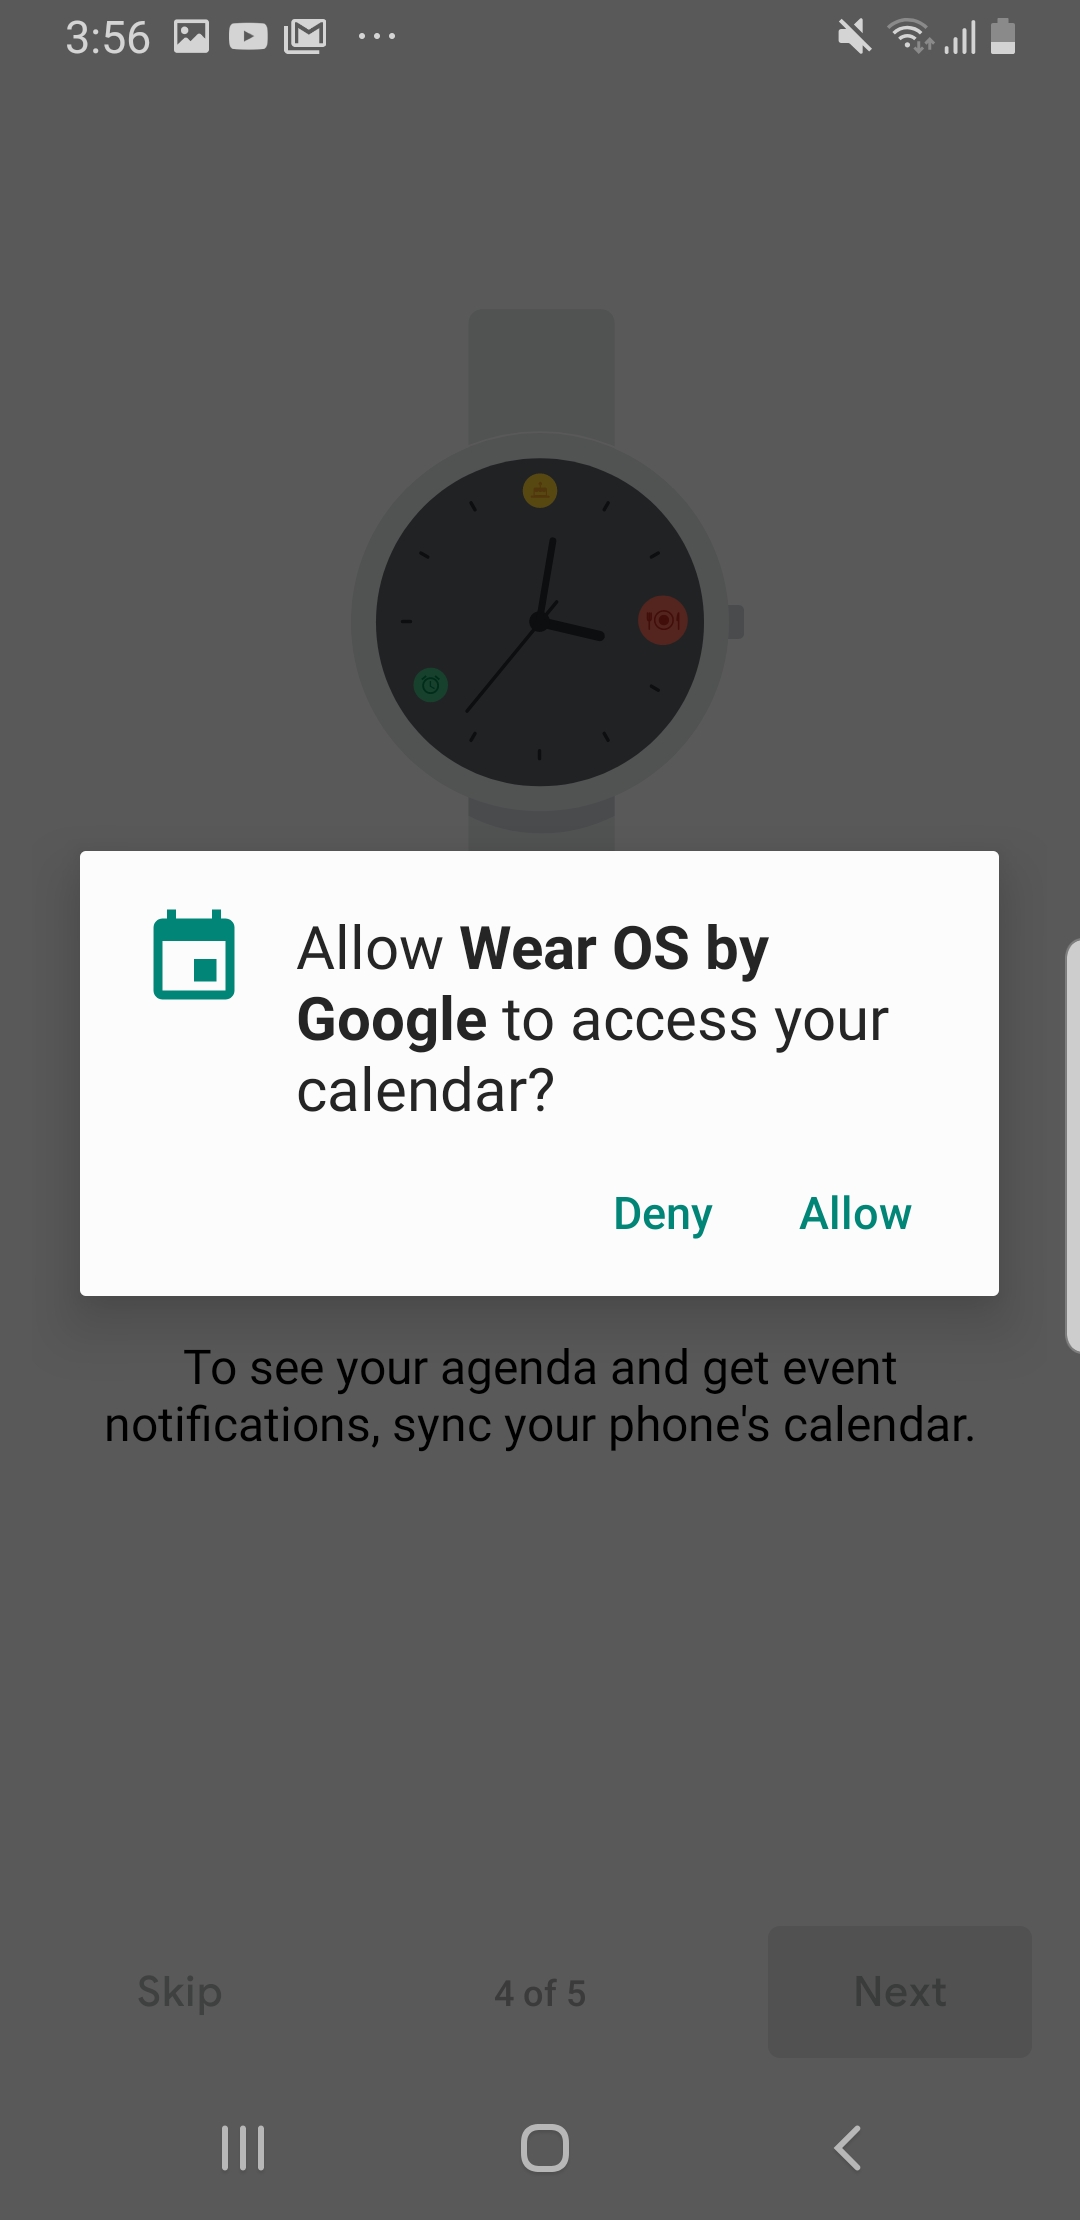
12. Under Check your calendar, press Next and press Allow for the calendar permission
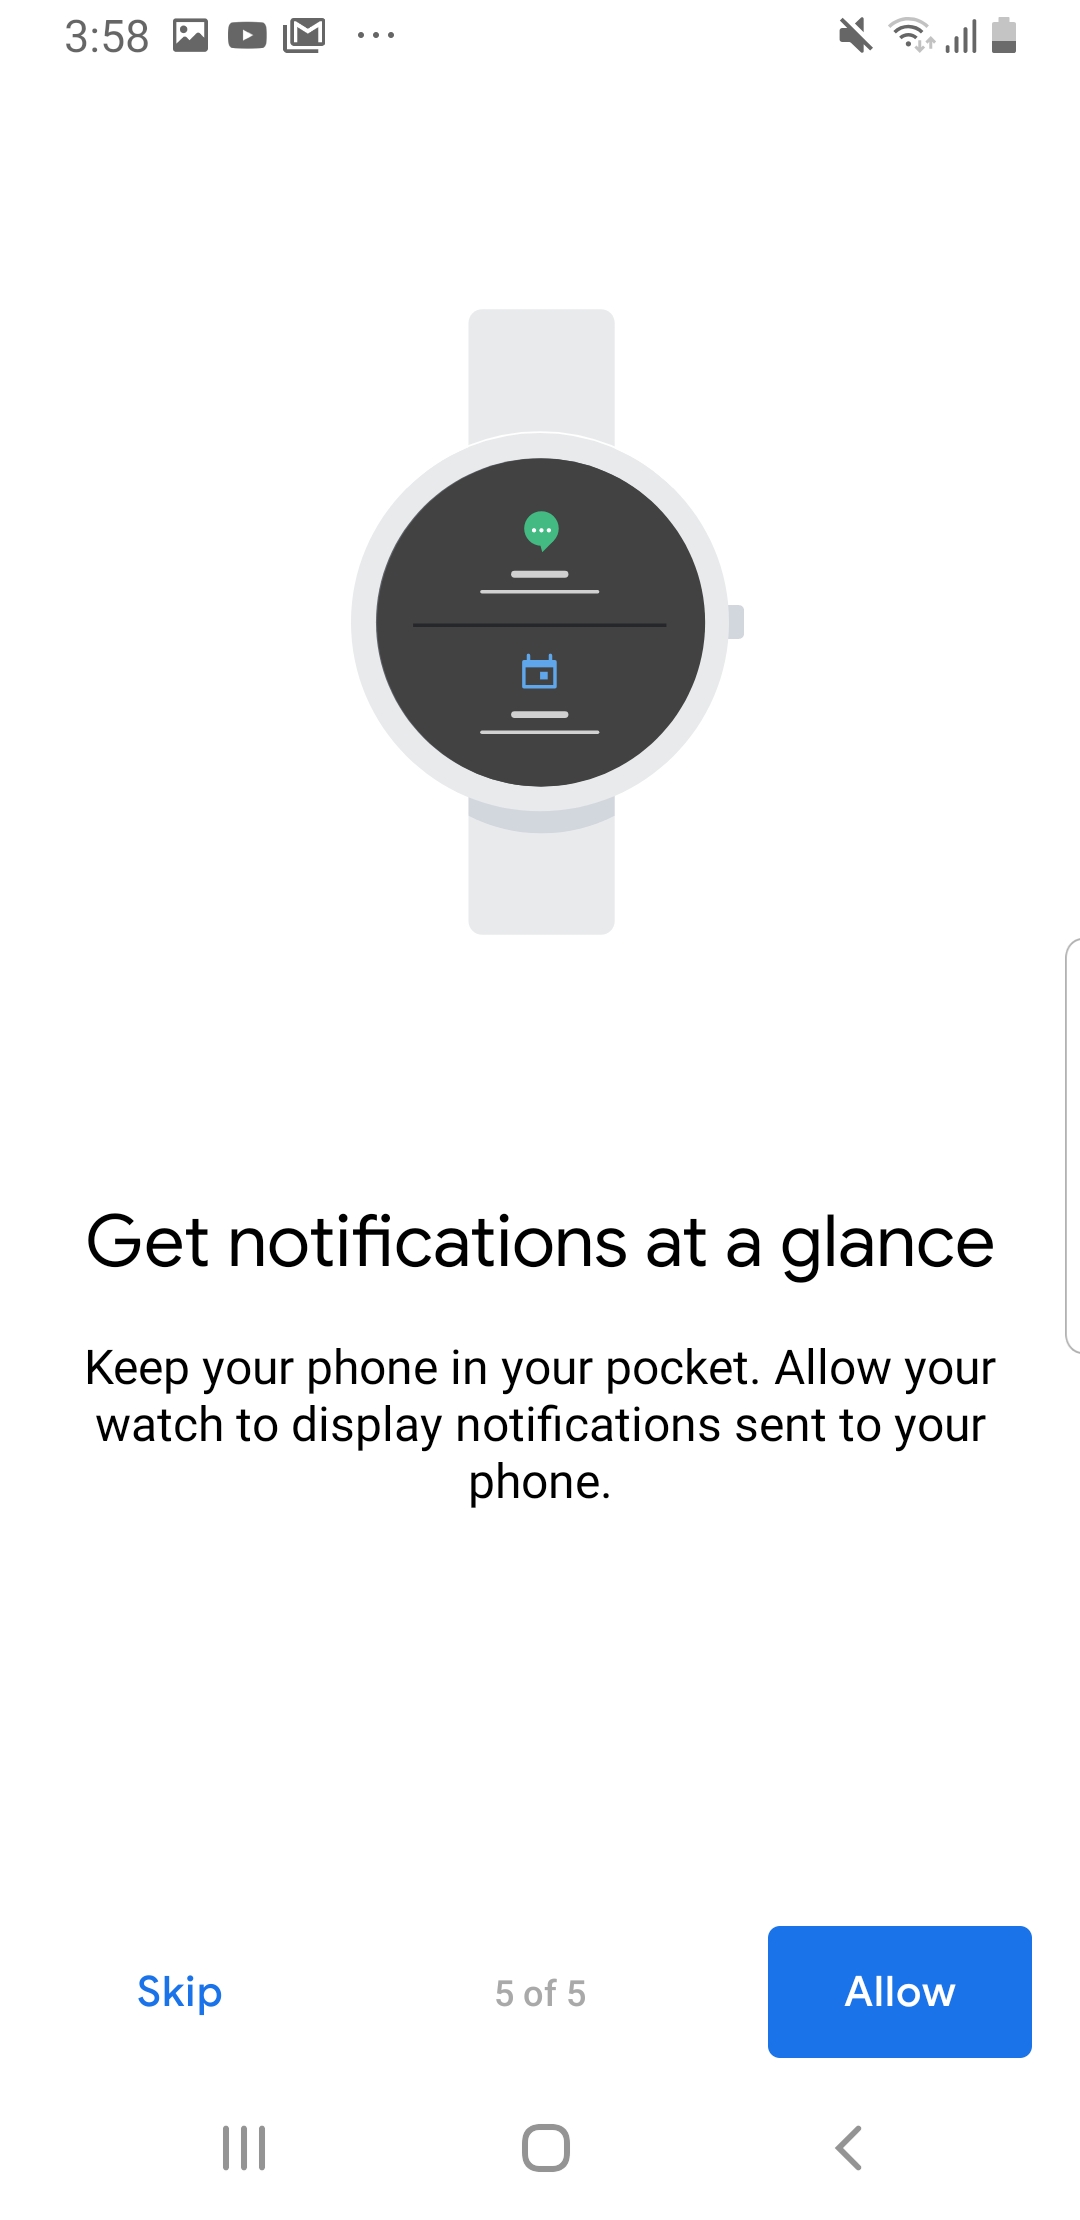
13. Under Get notifications at a glance, press Allow
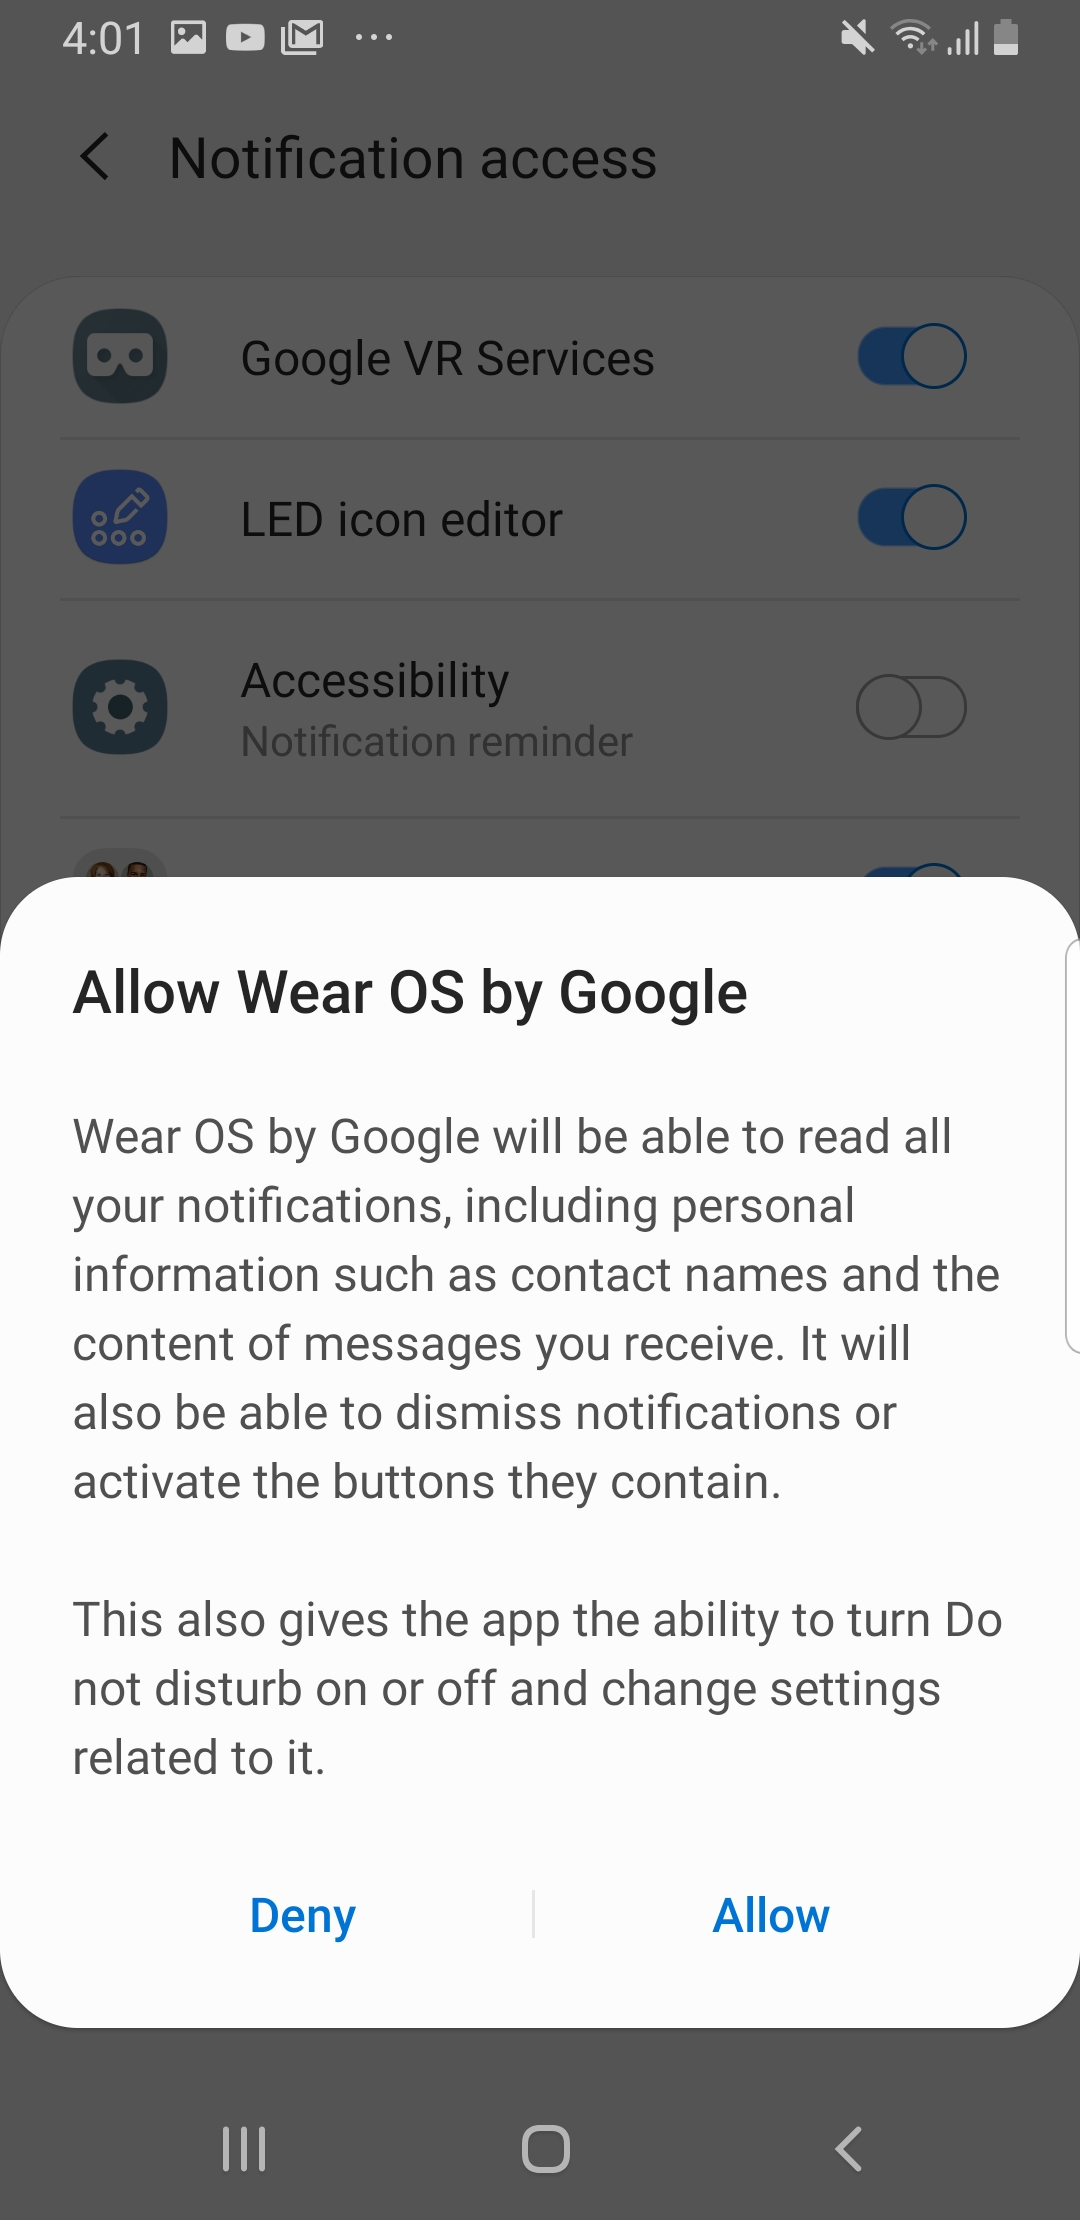
14. Tap on the slider next to Wear OS by Google (it’ll turn blue)
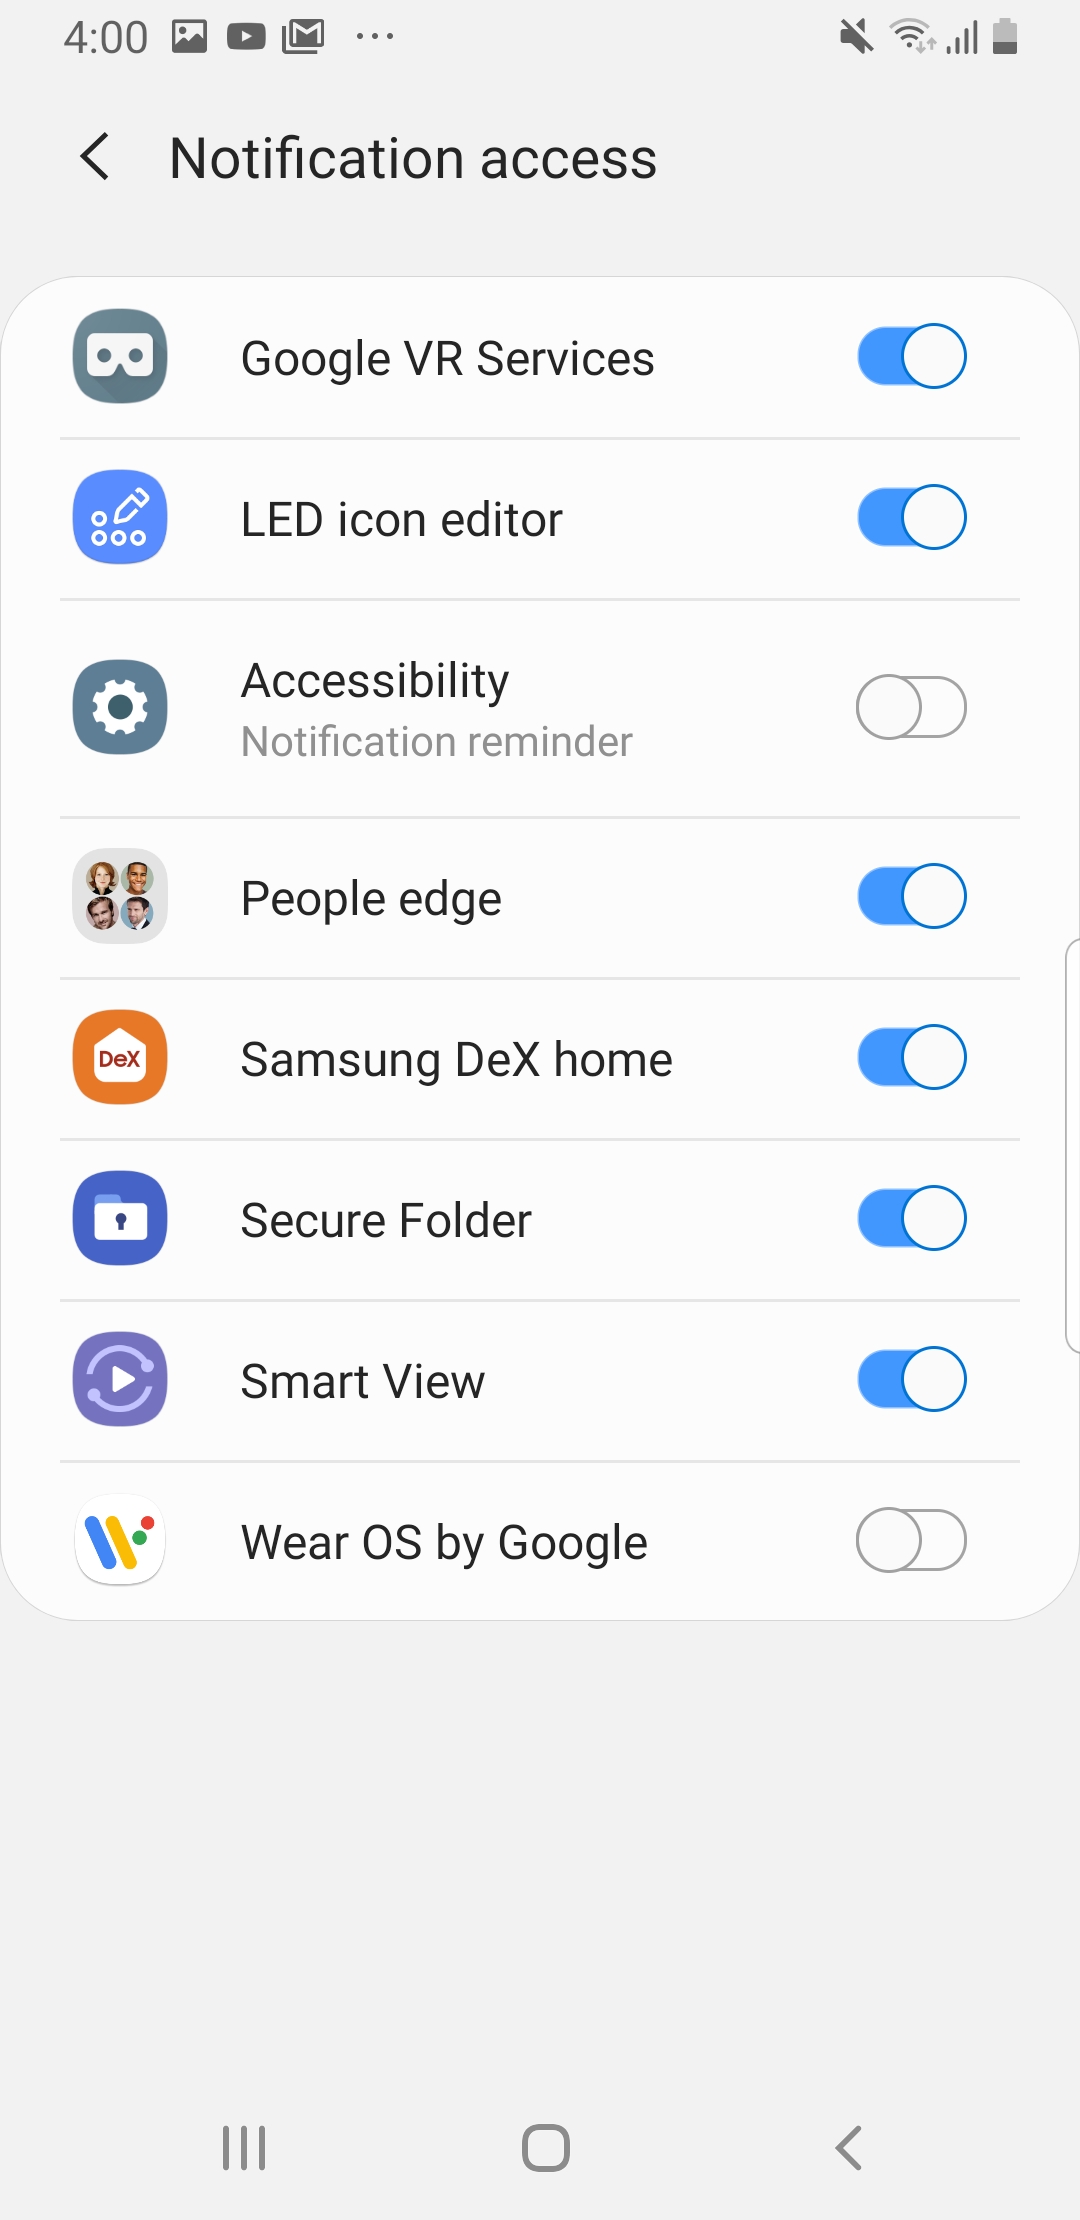
15. Press Allow on the Allow Wear OS by Google pop up
16. Press Next under Location notice
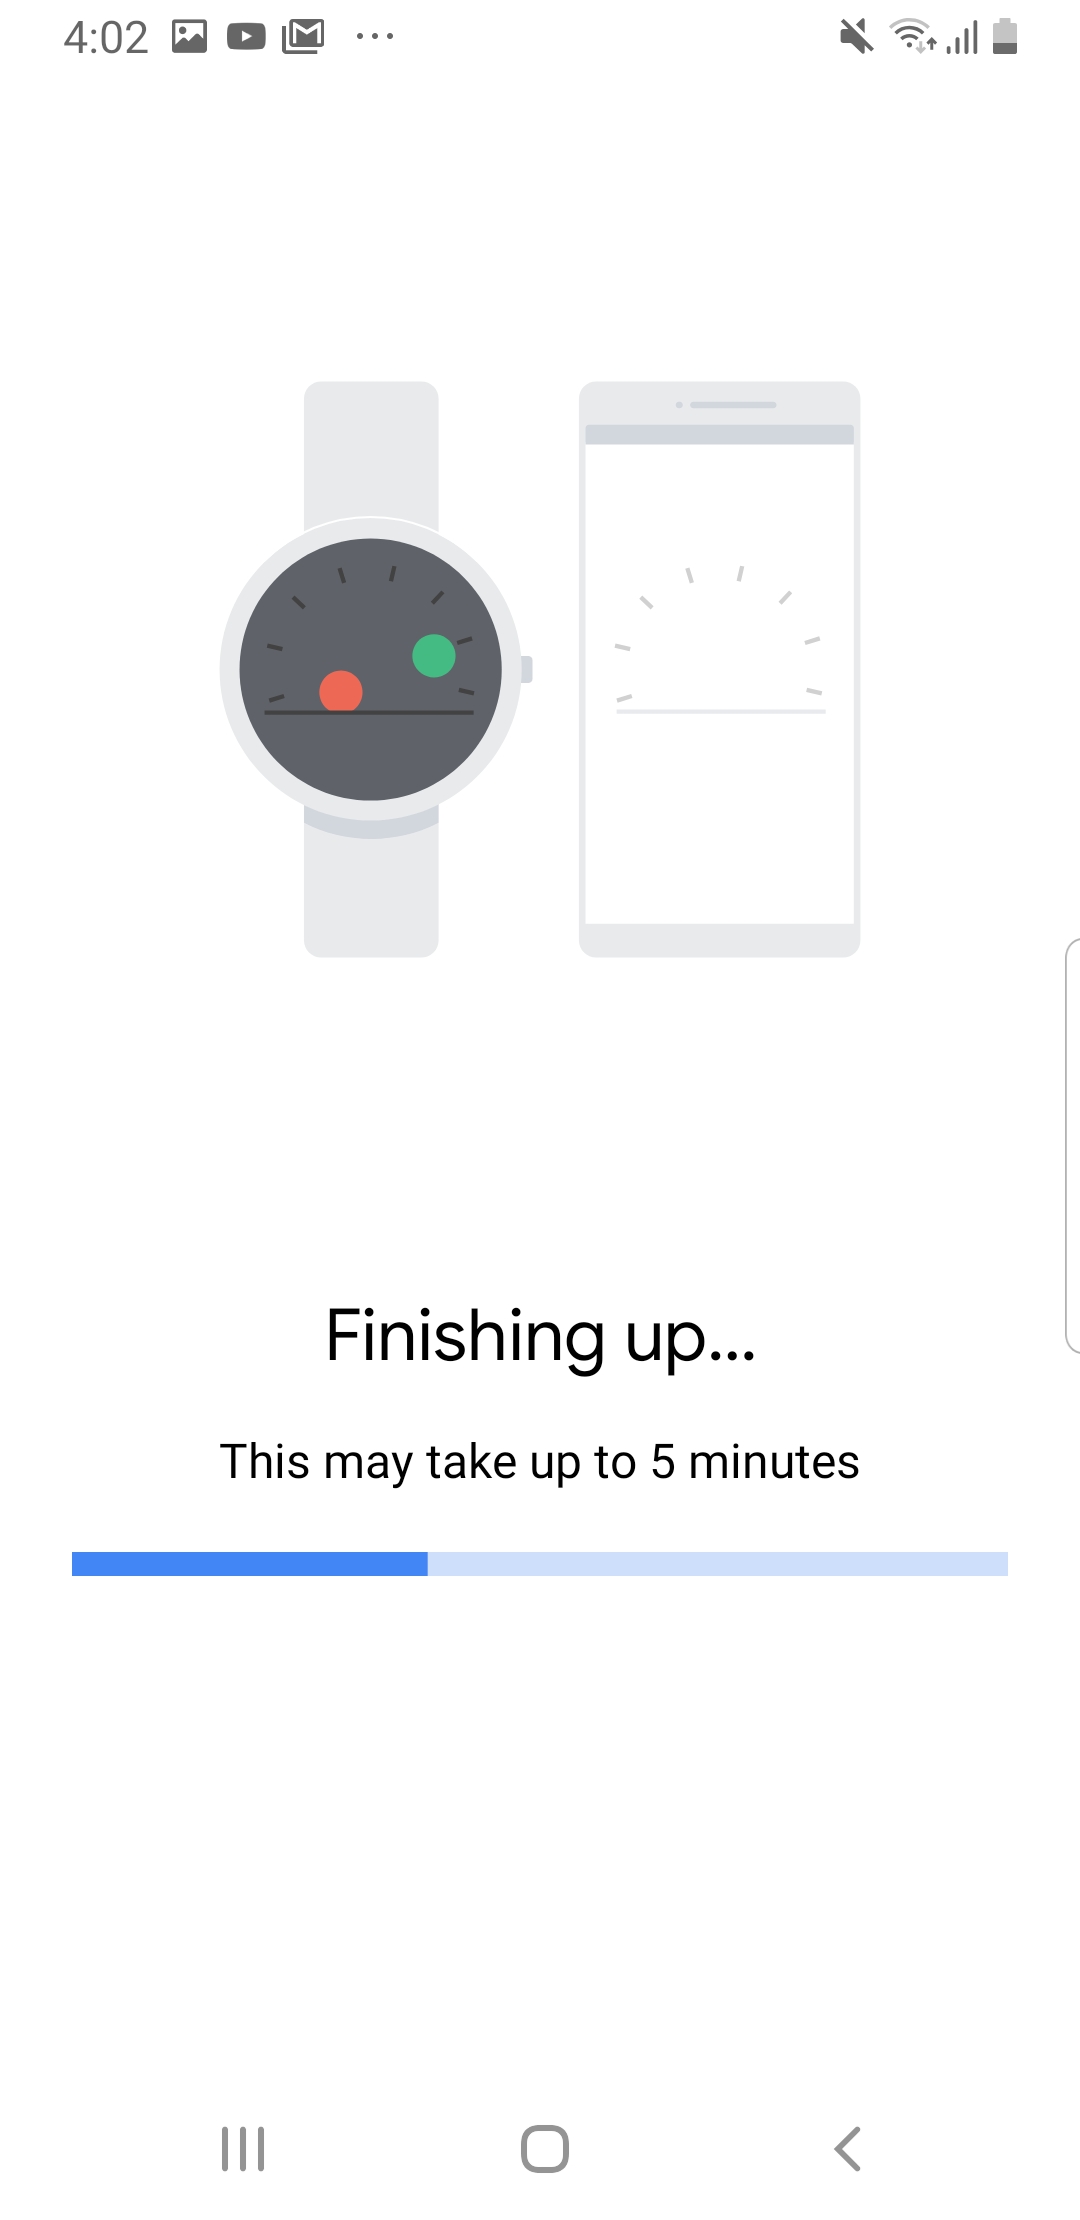
17. The phone will then continue to set up on its own (may take up to 5 minutes).
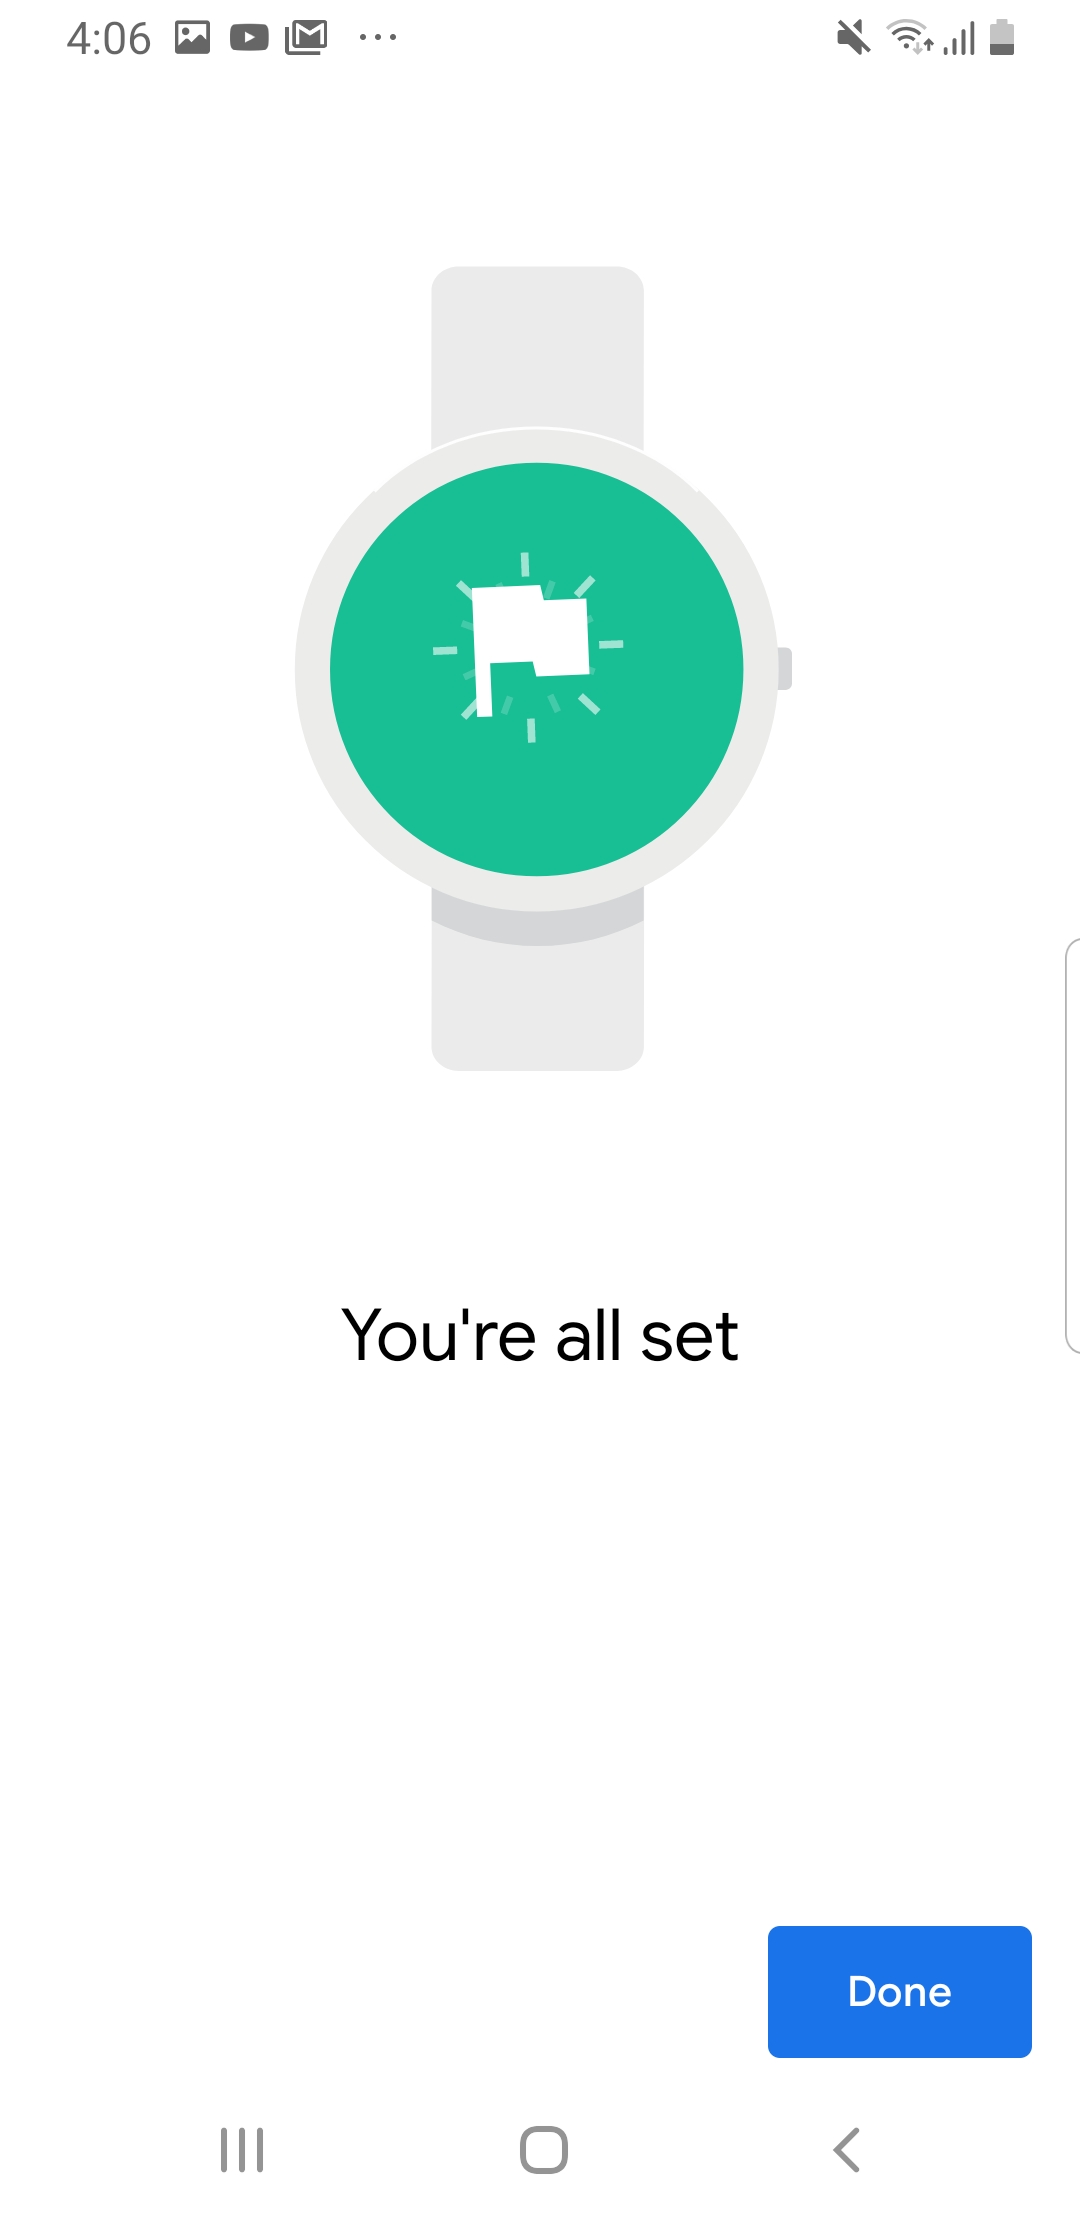
18. Once you see the You’re all set screen, press Done
3. Sign in to Google Fit on the Watch
Swipe from right to left on the watch
Tap the screen to sign in to Google Fit and use the Google account that you copied over to the watch
Fill in all the details and accept all the permissions
| Note |
|---|
At this point, the watch should be paired with the phone. A good way to know is to try and change the watch face by going into the Wear OS app on the phone and picking a different face. The face change should get reflected in the watch too. |
4. Download Insight from the Google Play Store
Choose the Google Play Store app from the participant’s phone
Search for Insight mHealth Platform
Choose Install
After the app downloads, choose ACCEPT
Open the Insight app
Click Allow to all permissions
At the “Do not optimize battery usage” prompt, choose YES
Create a participant in the CMS and set up the participant on the Insight app. Click here for instructions on participant set up.
| Info |
|---|
We recommend using the Code Method for setting up participants. |
| Note |
|---|
After you setup a participant on the Insight app, please wait for 15-20 minutes for all the setup to finish. If you start setting up participant on the Outsight app too soon, the connection might not be created correctly. |
5. Download mHealth Outsight from Google Play Store
Choose the Google Play Store app from the participant’s phone
Search mHealth Outsight
| Info |
|---|
If the mHealth Outsight app does not pull up in the search result, use the following link on the phones’s Google Chrome browser and press Open in app when it prompts you: https://play.google.com/store/apps/details?id=com.mhealth.corehardware |
Click on Install
Click on Open to open the Outsight app
Press Allow on all the permissions
6. Download mHealth OutsightAndroidWear app on the Fossil Watch
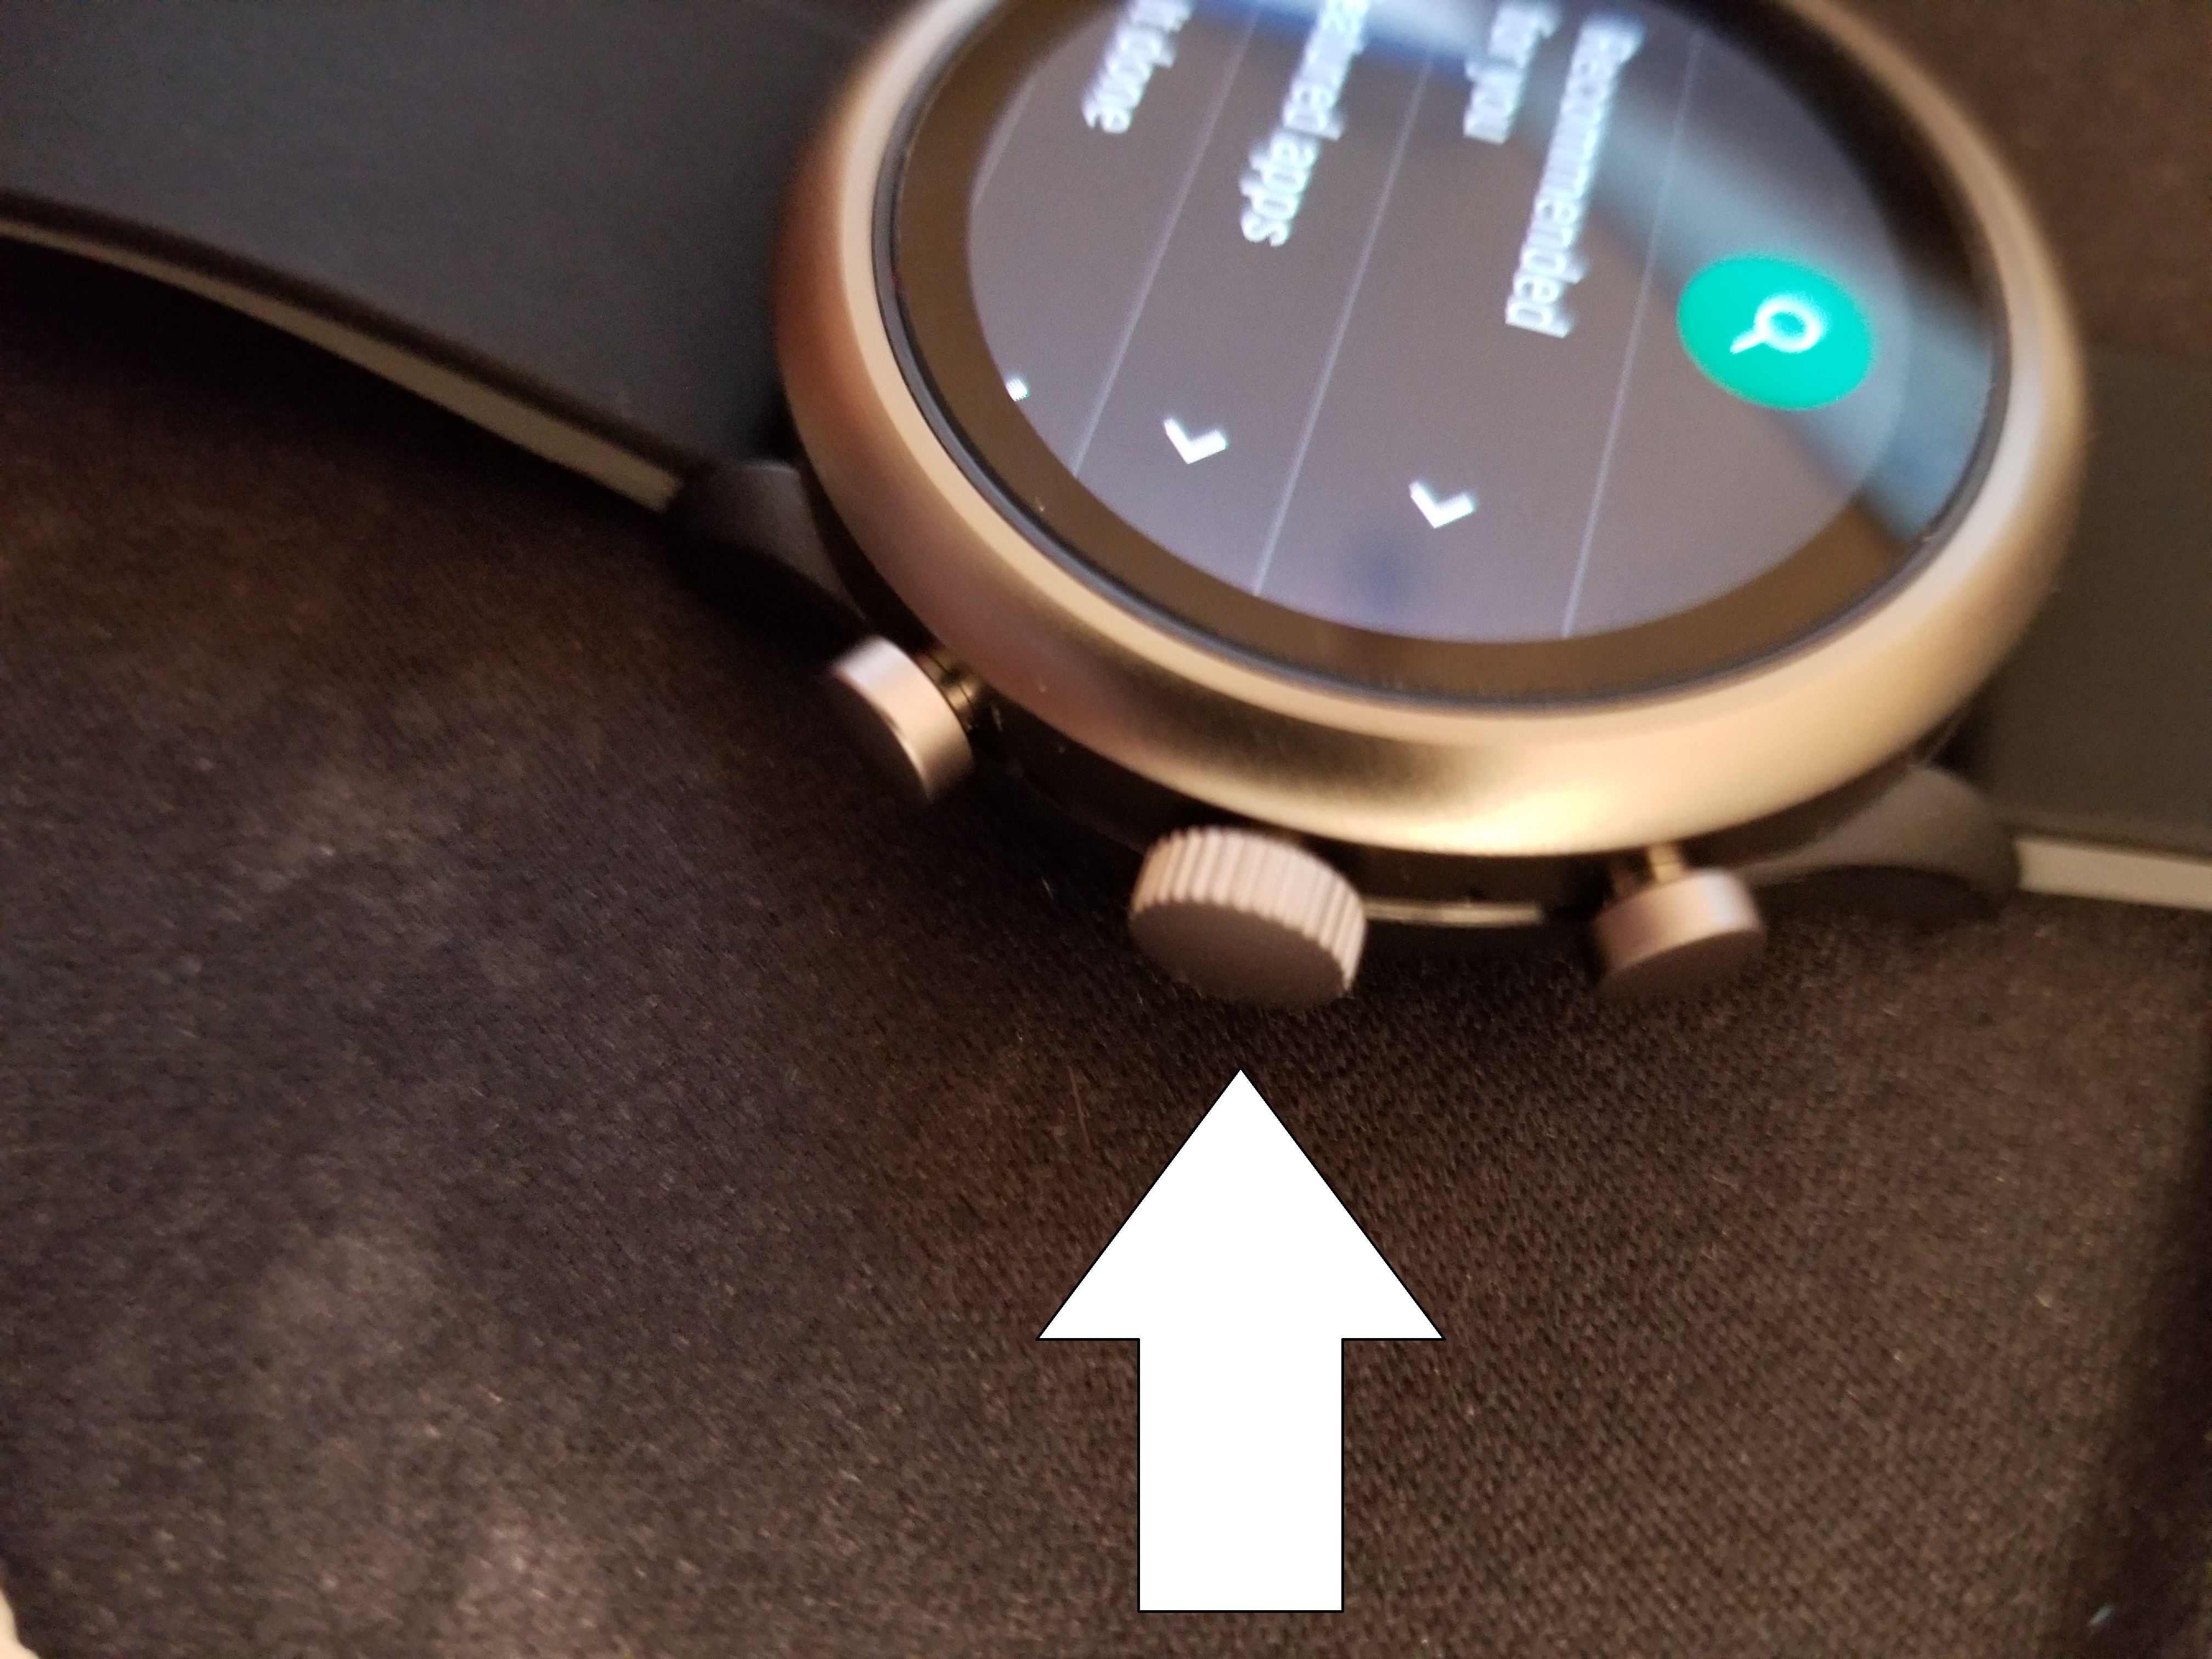
On the Fossil watch, press the middle dial to open up the watch’s list of apps.
Click on Play Store
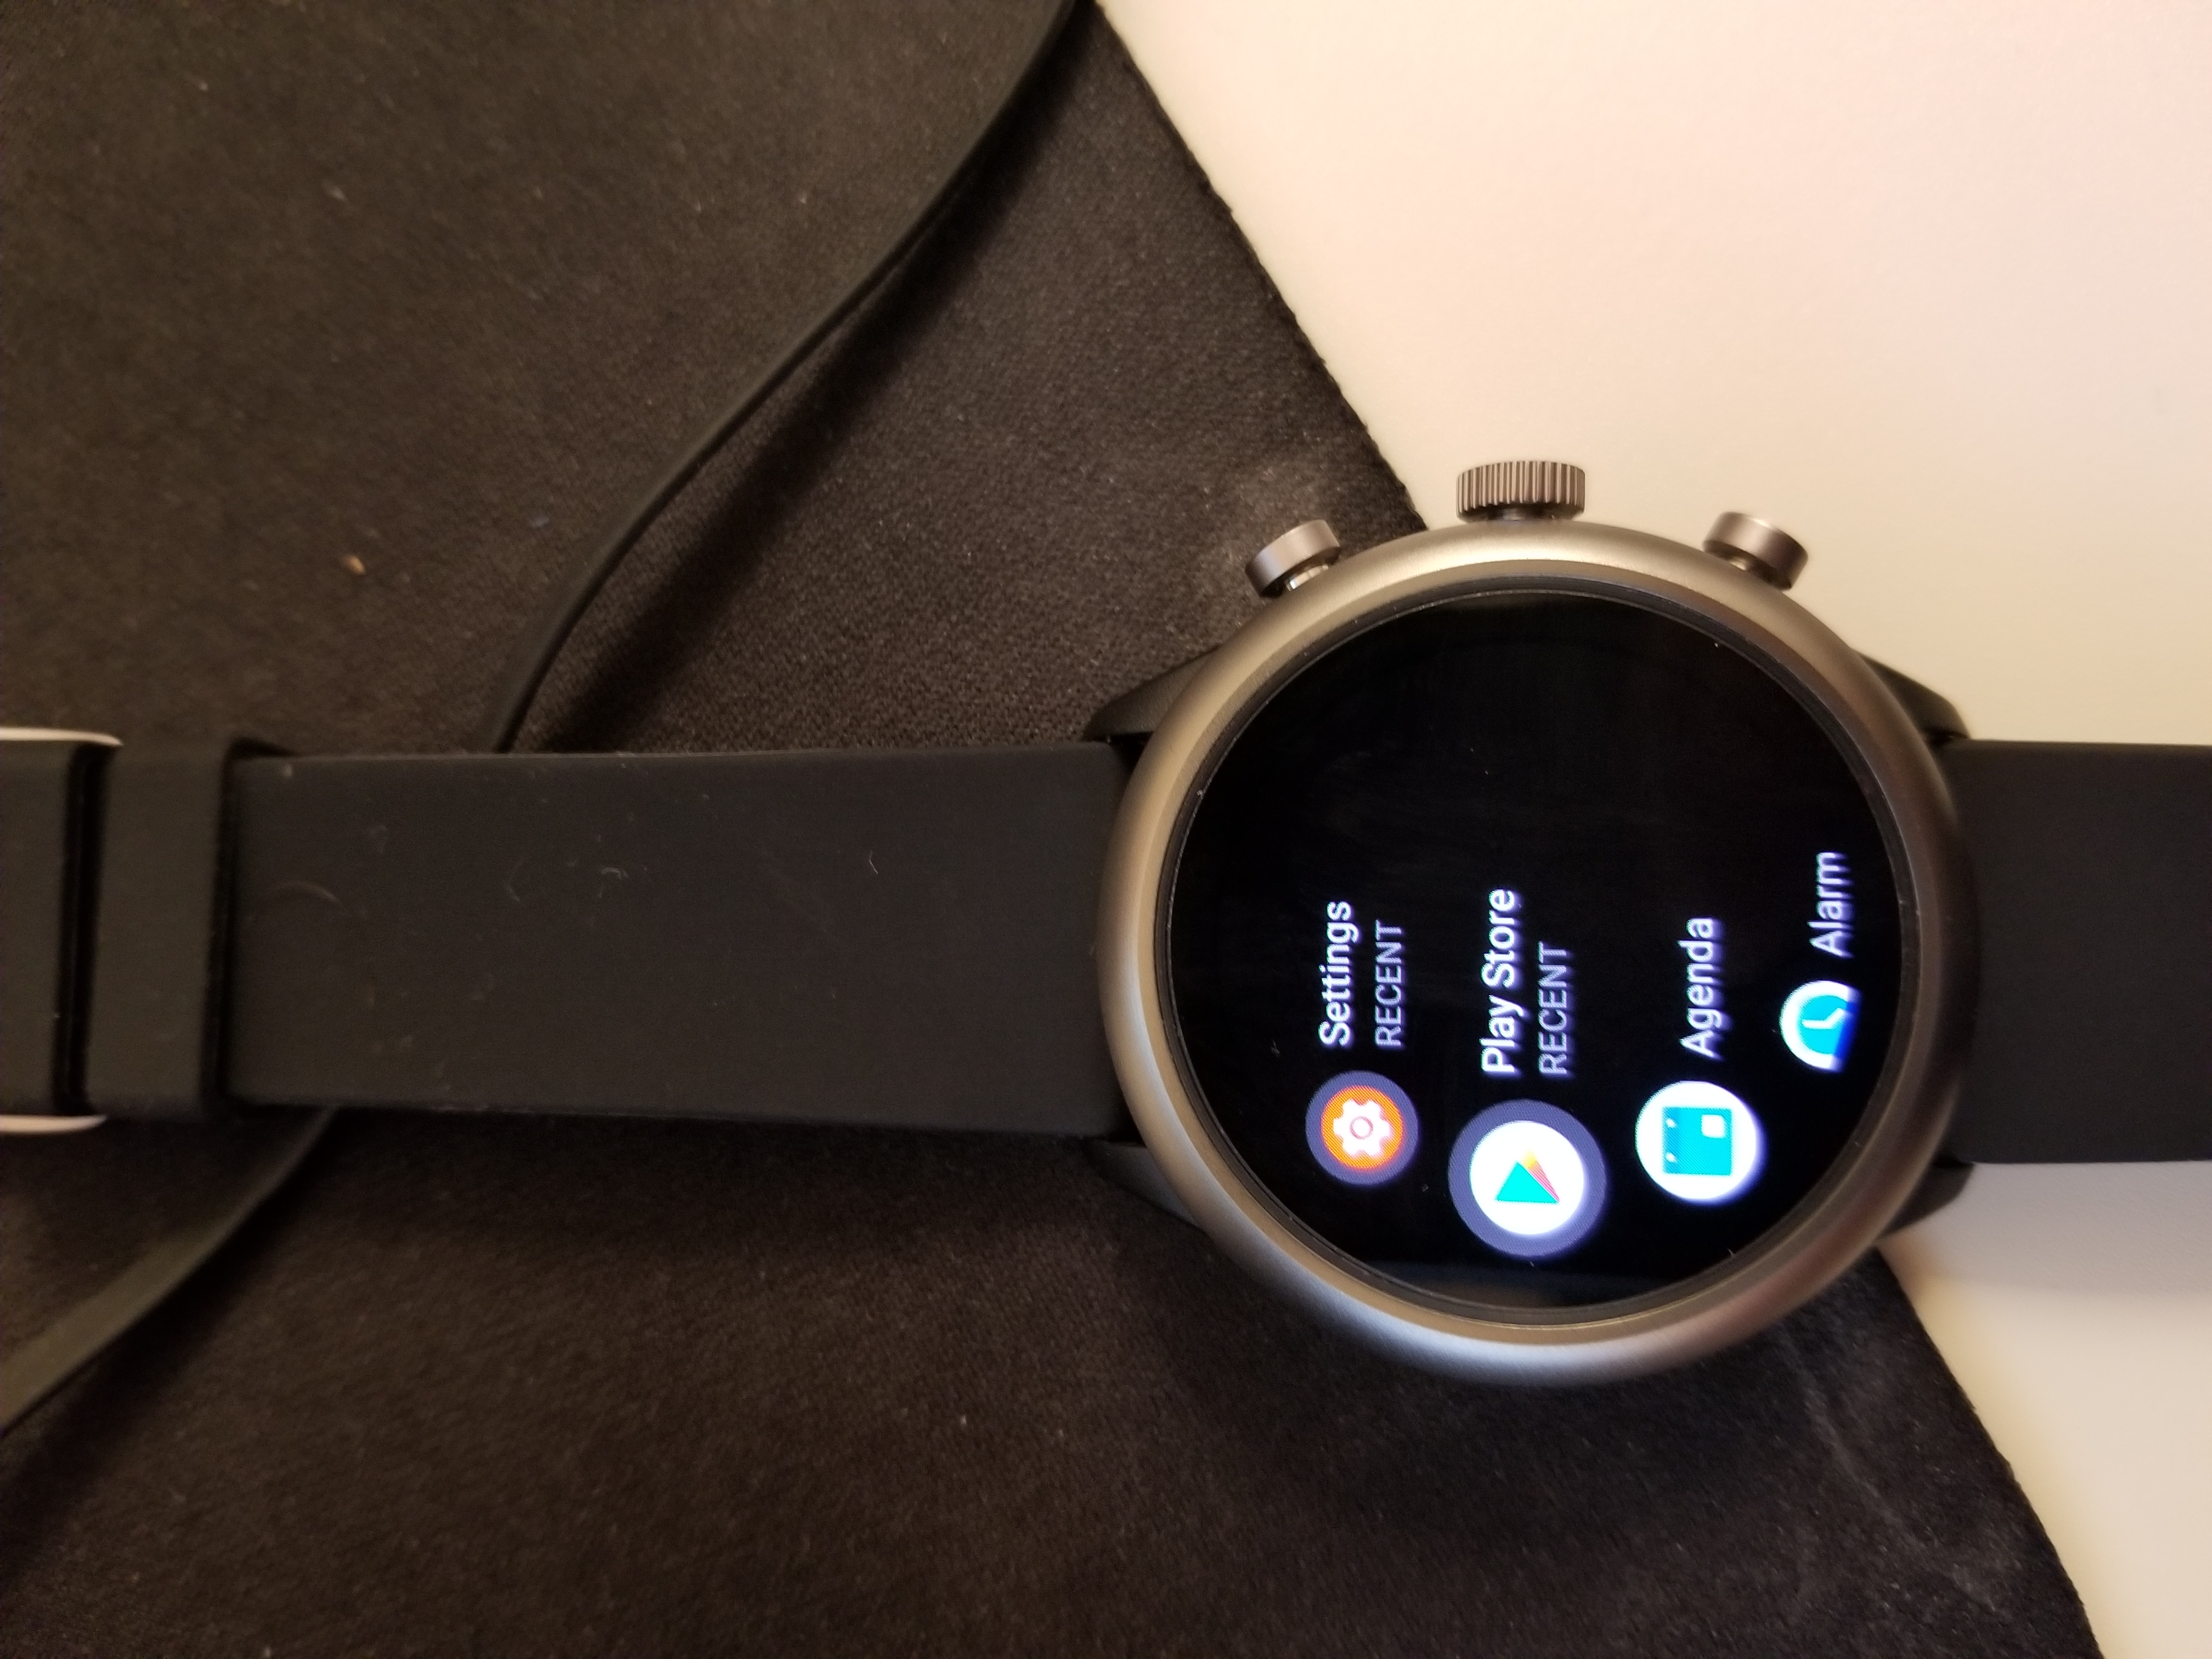
Scroll down until you see Outsight under Apps on your phone and click on the download button
Open OutsightAndroidWear in your list of apps, and accept the sensor permission
Note: The Fossil Watch will need to update it’s Play Store. Ensure that there is a good Wi-Fi connection and allow it to update while the watch is charging. This process may take 5-15 minutes. Typically, OutsightAndroidWear will automatically download to it. If it does not, a search through the watch’s Play Store as described above will work.
Troubleshooting
Ensure WEAR OS, Insight, and Outsight remain open and running in the background.
If the app is open, Click the “Home” button (typically located at the bottom, center of the phone) to allow the app to run in the background. Example of a Recent window below:
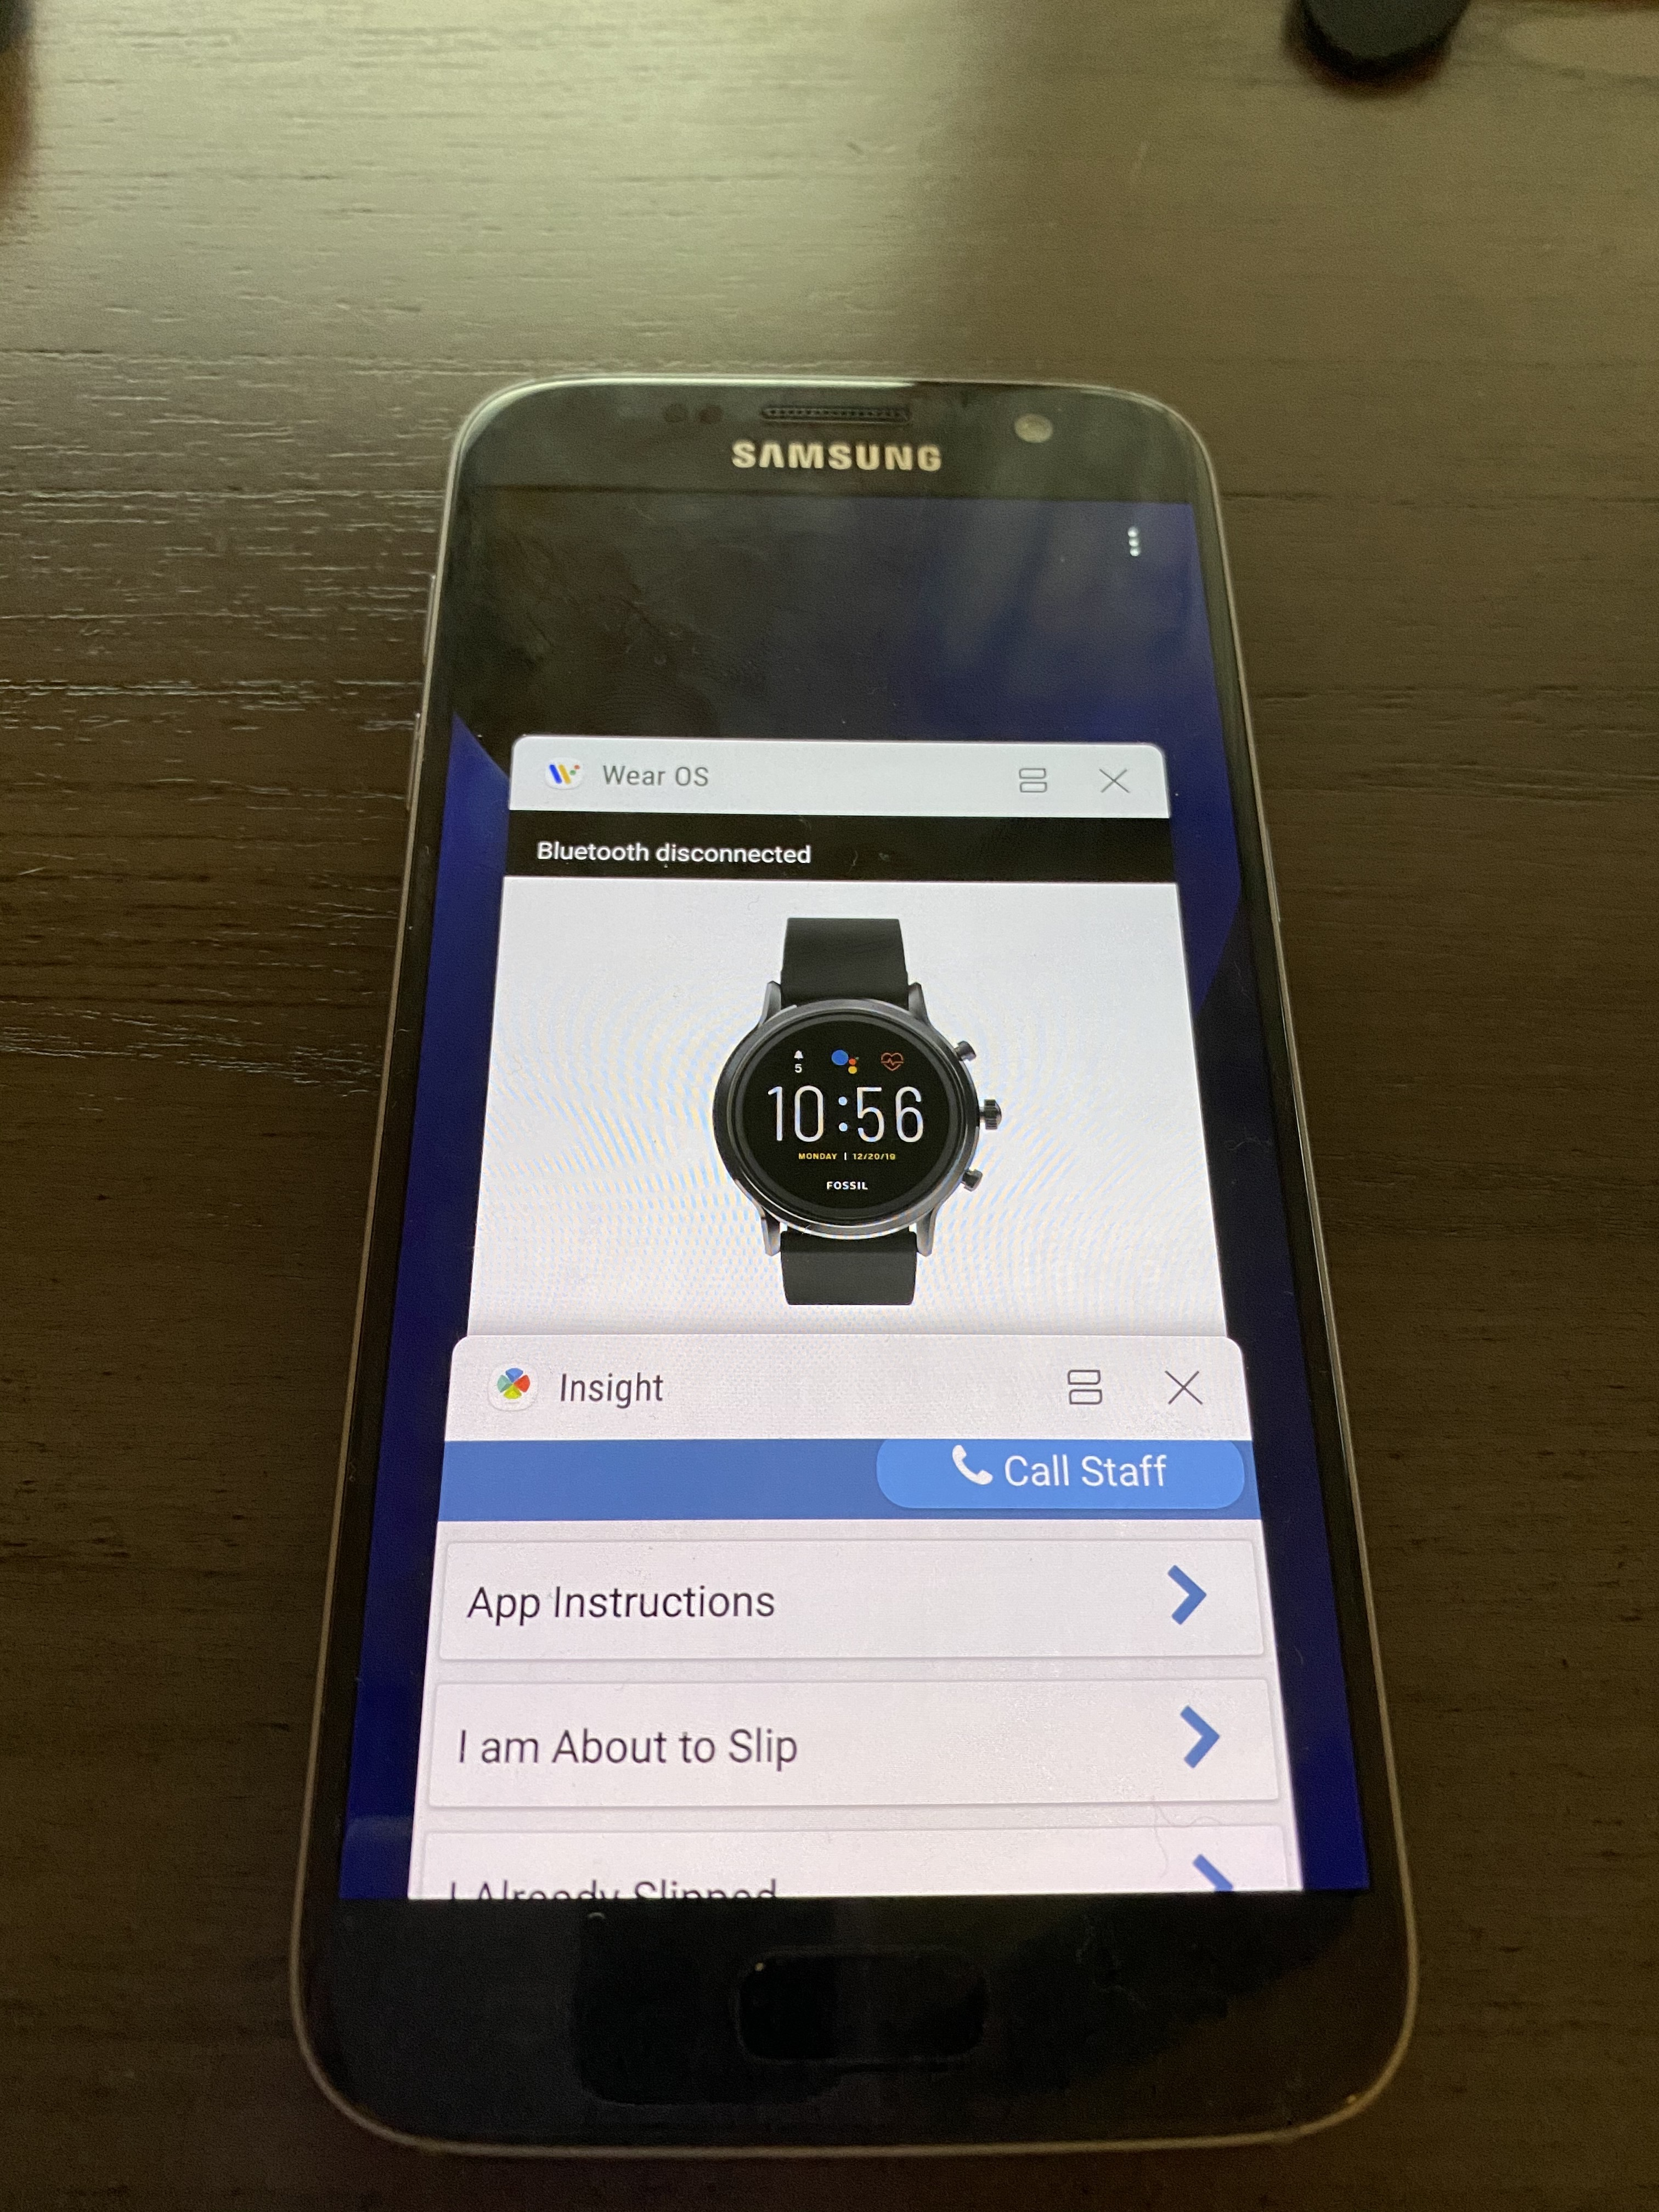
Note: If the app(s) are not displayed in the “Recent” window then the app(s) are closed; this prevents any background operations which hinder collecting sensor data.
Verify there is a connection between the smartwatch and phone.
Open the WEAR OS app on the phone → under the watch name “connected” will appear if the phone and watch are paired.
If WEAR OS signifies there is no connection, reestablish the connection by hitting reconnect
If there appears to be no connection, open Outsight and Insight on the phone.
This can reestablish a connection between Outsight to Insight to allow sensor readings.
Restart the phone and watch if the above methods do not produce the expected results.
Restarting Phone: hold down the power button (typically on the side of the phone) until Restart Phone appears → Click Restart Phone
Restarting Watch: hold down the large middle dial on the side until Restart appears → Click Restart
Attempt to pair multiple phones and watches while thoroughly reading the instructions (starting from 1. Download Wear OS) to gain more experience; doing this can reduce quantity of errors when pairing the phone and watch.
Supported Devices:
Fossil Smartwatch 5th Generation
...
| Expand | ||
|---|---|---|
| ||
a. If this formula evaluates to
b. If left blank or if the formula evaluates to c. This formula is not limited to sensor specific formulas. The usual question based formulas work here as well if you need to reference other data.
Sensor Specific Formulas
Using Sensor Data in a Follow Up Event
|
...
iii. Greenphire Participant – type in the 8 digit Greenphire Master Card number on the card that is given to this participant.
iv. Rich Text Setting –
v. Pedometer Goals – Participant specific goals; if the setting is present at the question and participant level, the participant level setting will take precedence. More information about Pedometer Configuration here.
...